Tradelyser Logo
Market Reports

Indian-market briefs from the open to monthly regime.

A focused set of NSE & BSE reports — each answers one question: what matters now, and for whom.

TradeLyser Market Reports for Indian markets

ALL REPORTS

Ten reports. One question each.

Scan the suite, then open any report for screenshots, publish times, and details.

PUBLISH TIMELINE

When each report lands

All times are IST (job start; report appears shortly after). Day flow first — then weekly and monthly at the end.

Published · IST8:15 AMMon–Fri

Pre Market

Start every session with a single brief instead of ten tabs. Pre Market stitches overnight global cues, GIFT Nifty, India VIX, index levels, and F&O positioning into a clear open bias — so you know what matters before the first candle prints.

Use: Build the day’s bias before 9:15 — global cues, India tape, levels, derivatives, and pre-open news.

Best for: Intraday and F&O traders who plan entries before the bell

Core details

  • Bias & TL;DR
  • Global pulse
  • India indices / VIX / GIFT
  • Technical levels
  • Options & futures snapshot
  • Institutional flow hints
  • News that can move the open
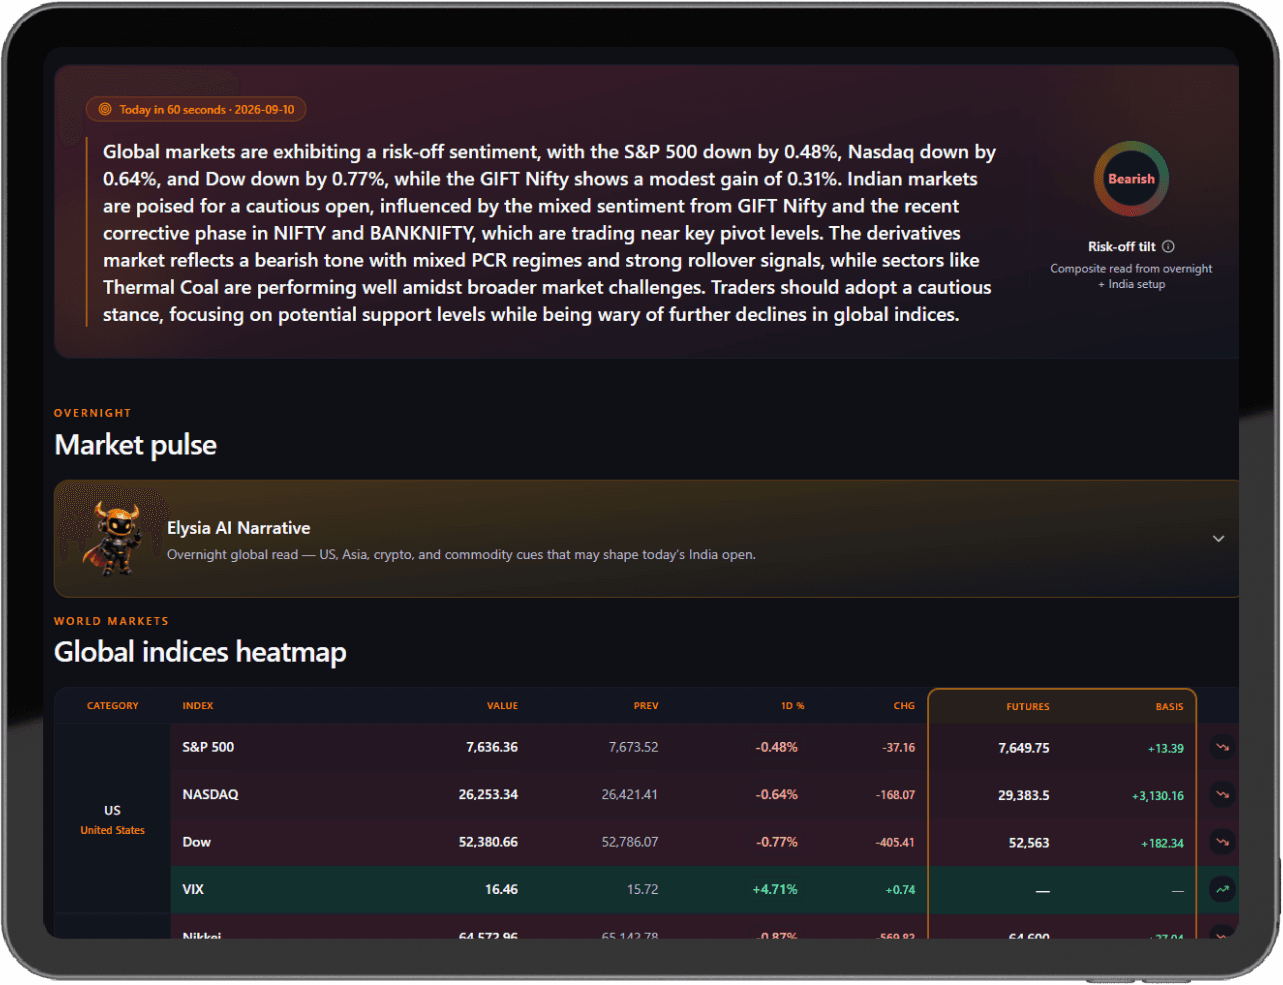
Pre-Market — Overview
Pre-Market — Overview

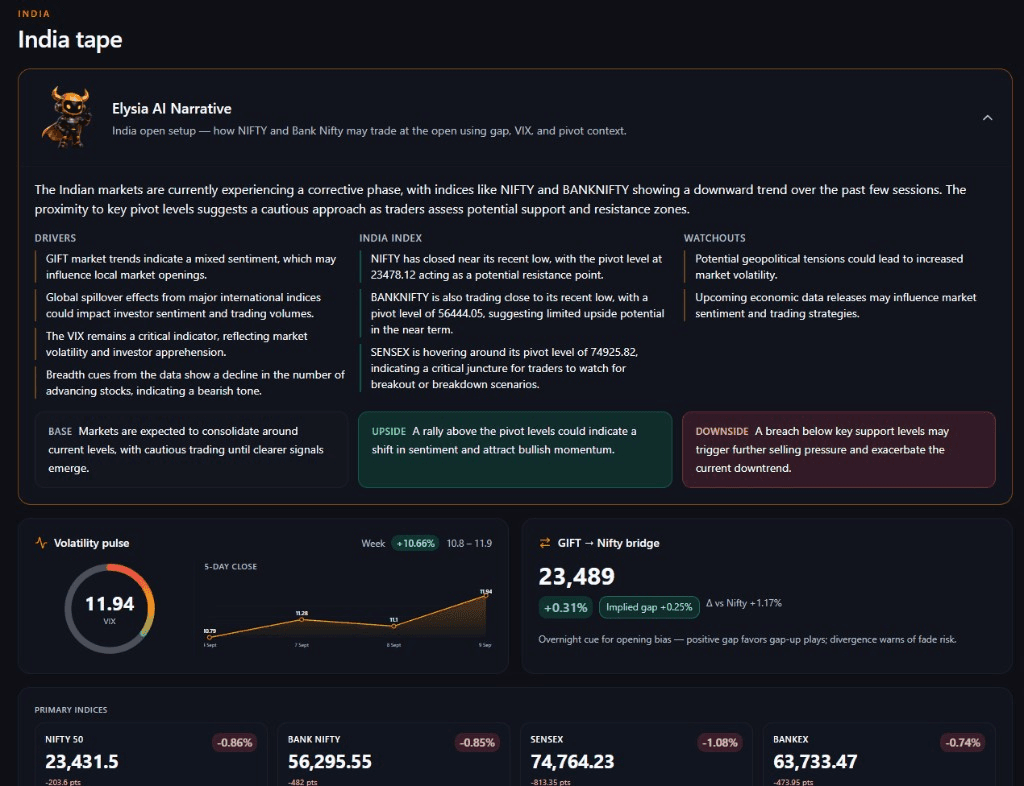
Pre-Market — India Tape
Pre-Market — India Tape

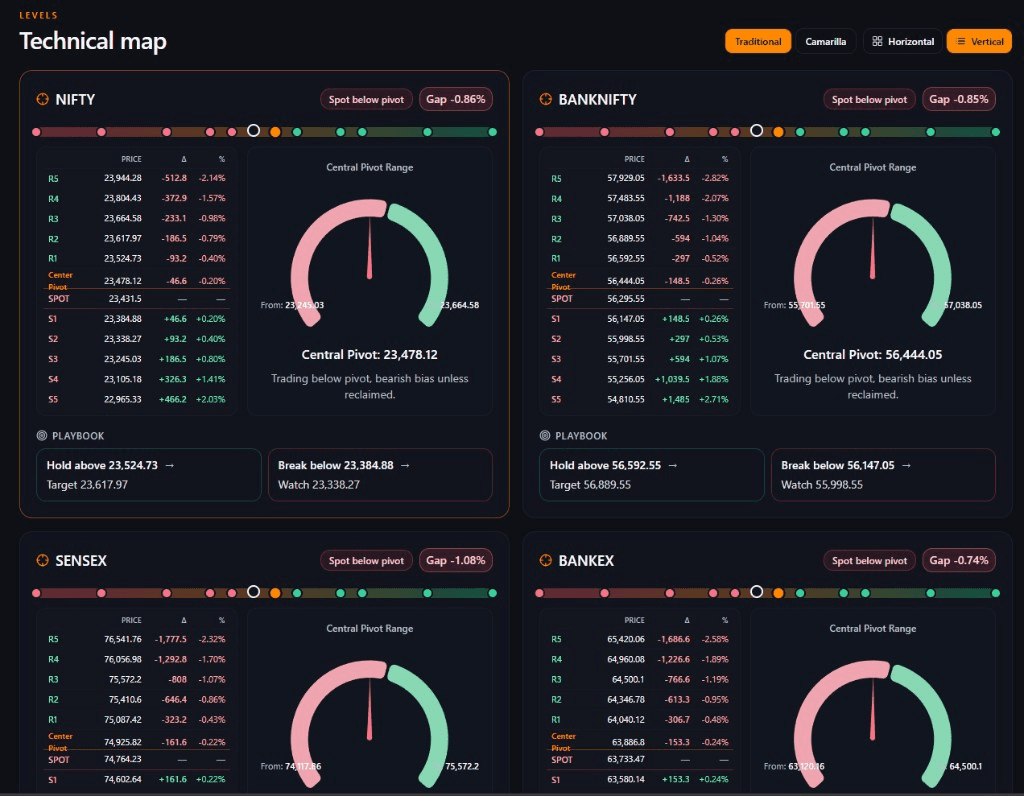
Pre-Market — Technical Levels
Pre-Market — Technical Levels

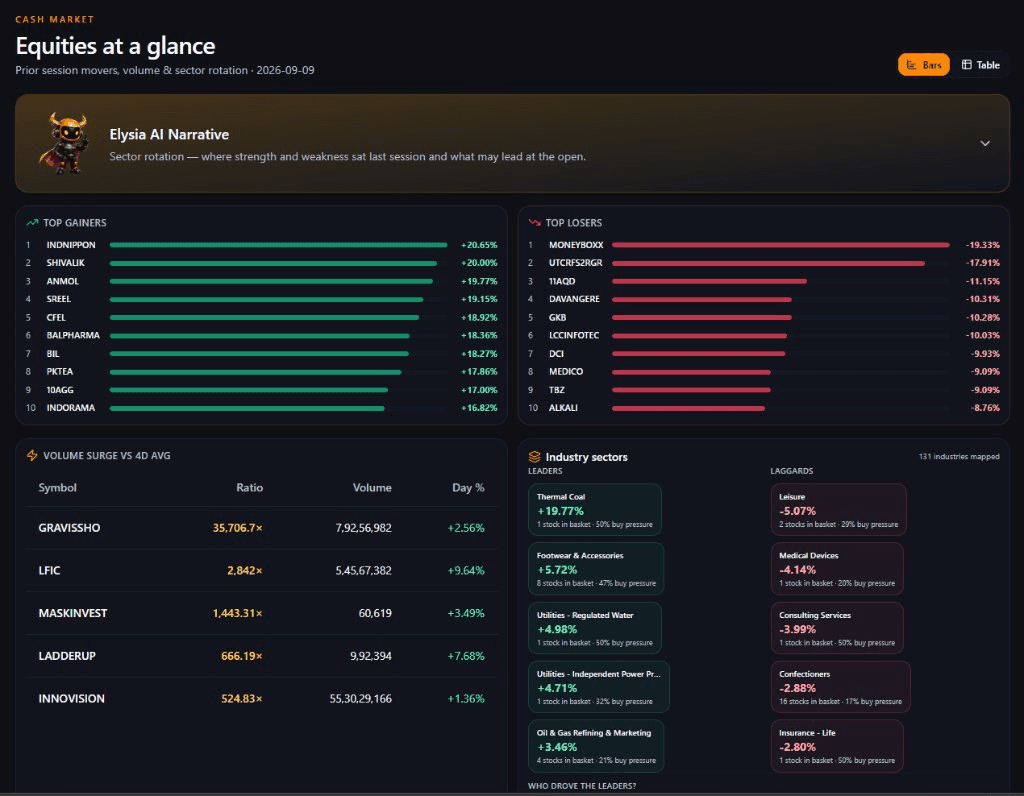
Pre-Market — Equities at a Glance
Pre-Market — Equities at a Glance

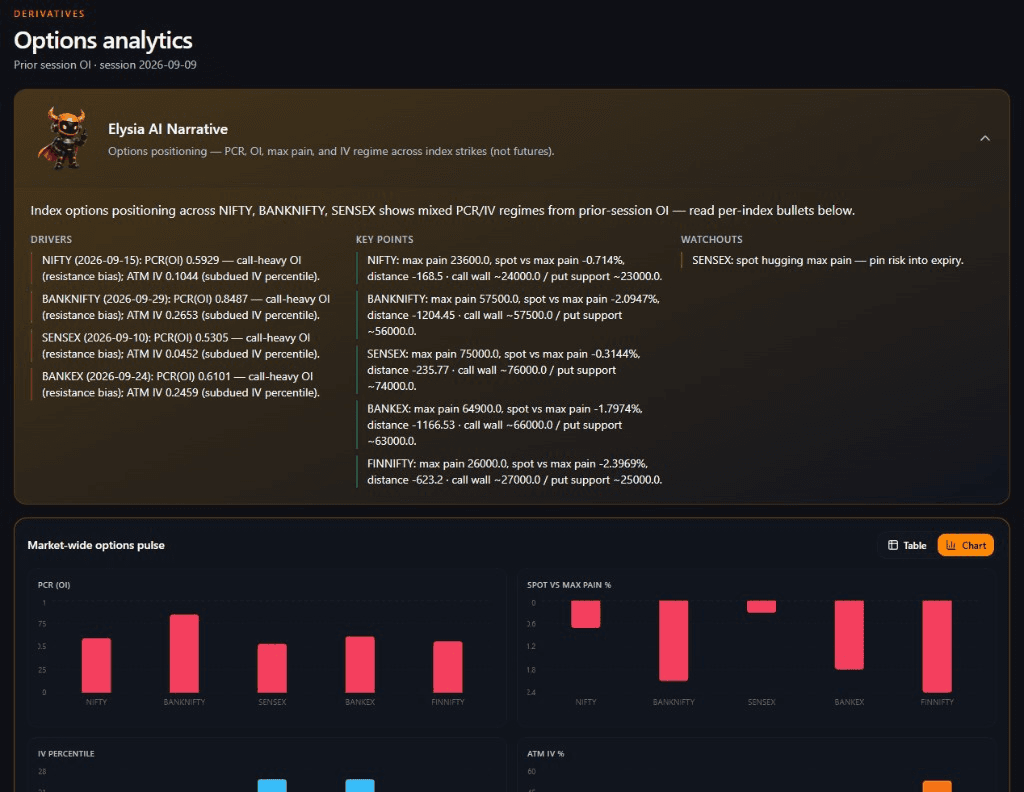
Pre-Market — Options Analytics
Pre-Market — Options Analytics

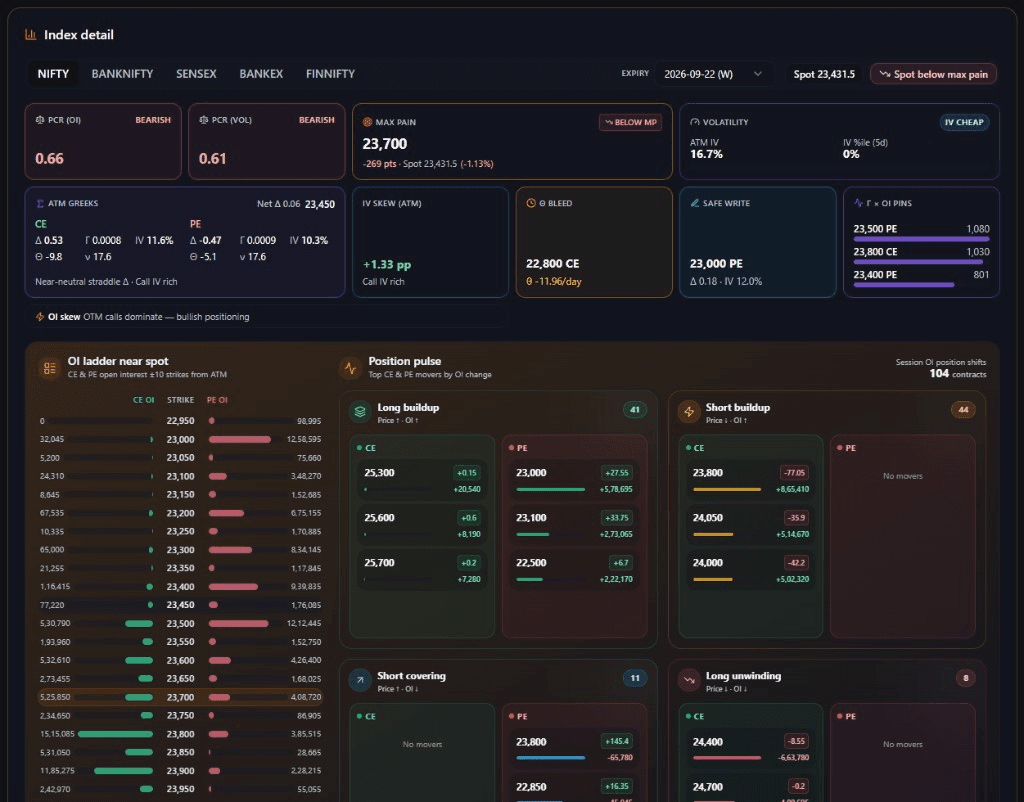
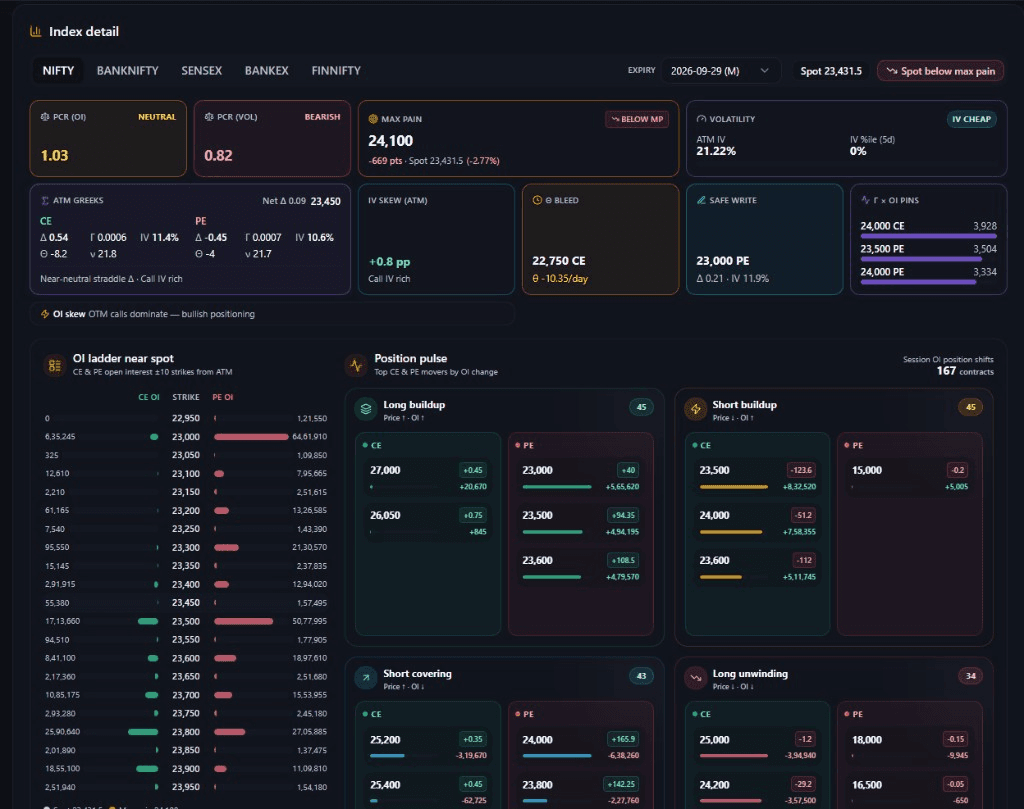
Pre-Market — Index Detail
Pre-Market — Index Detail
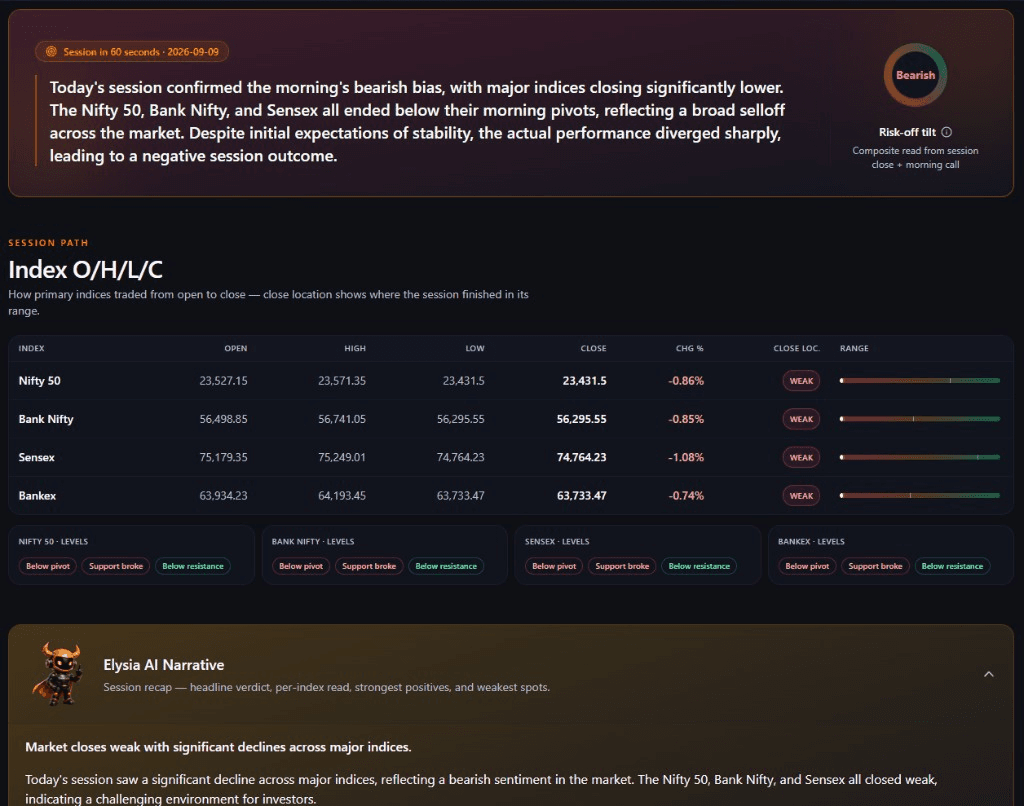
Post-Market — Session Overview

Post-Market — Session Overview

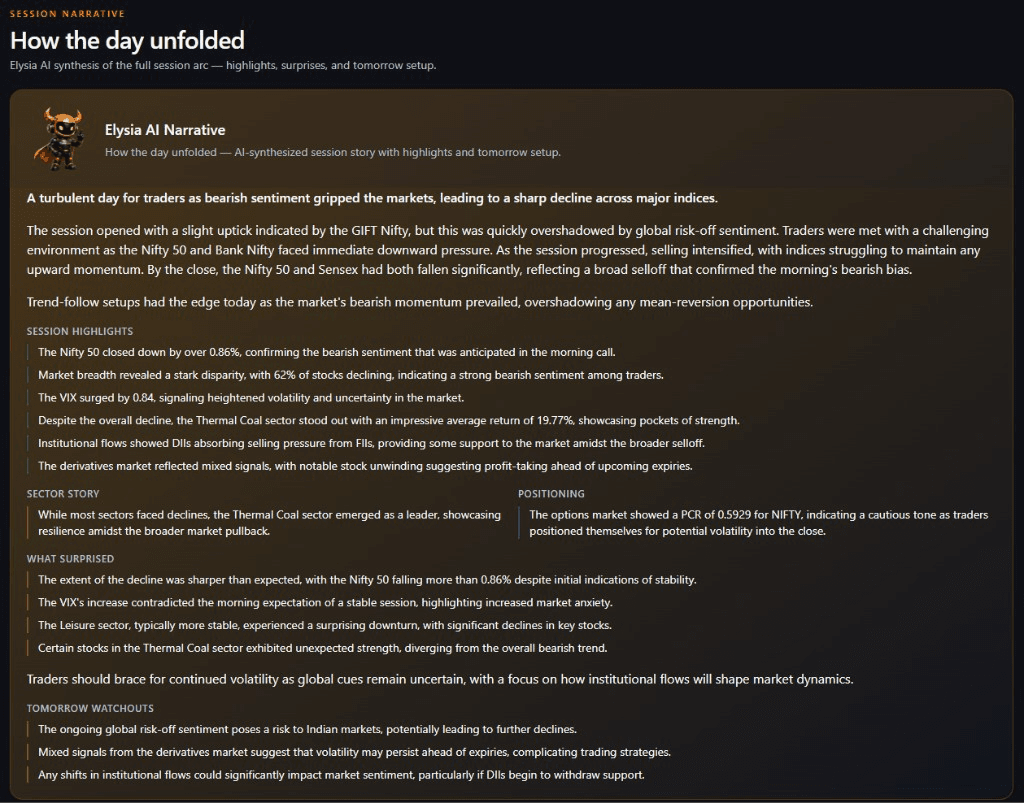
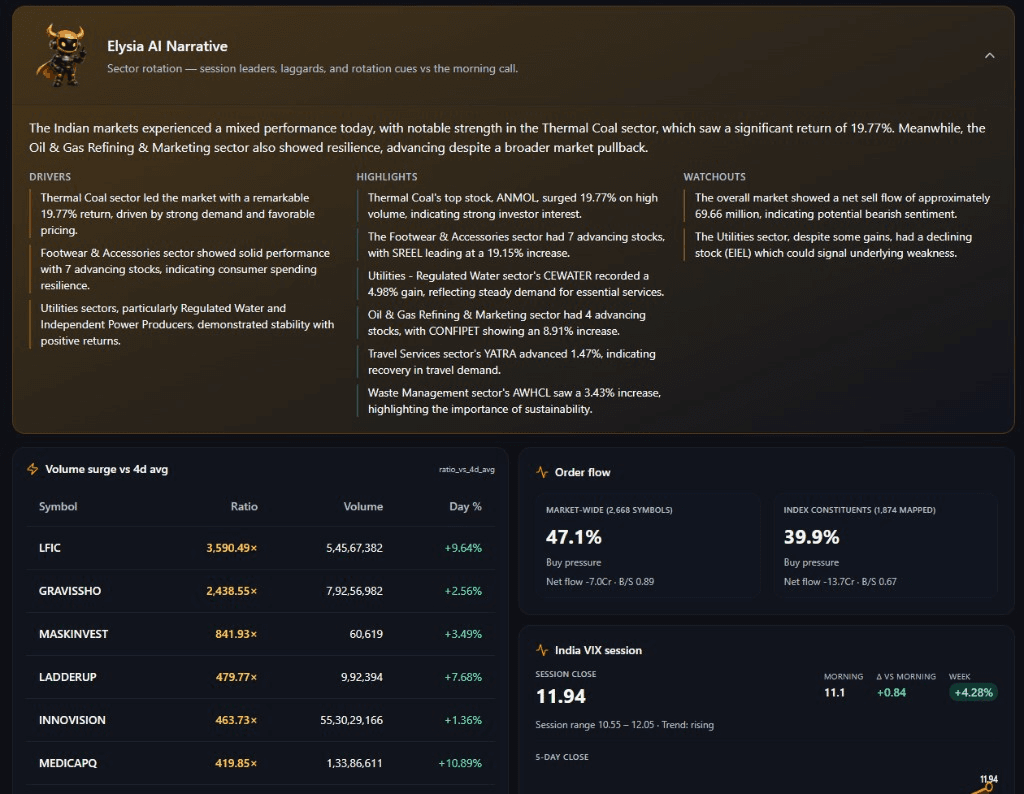
Post-Market — Session Narrative

Post-Market — Session Narrative

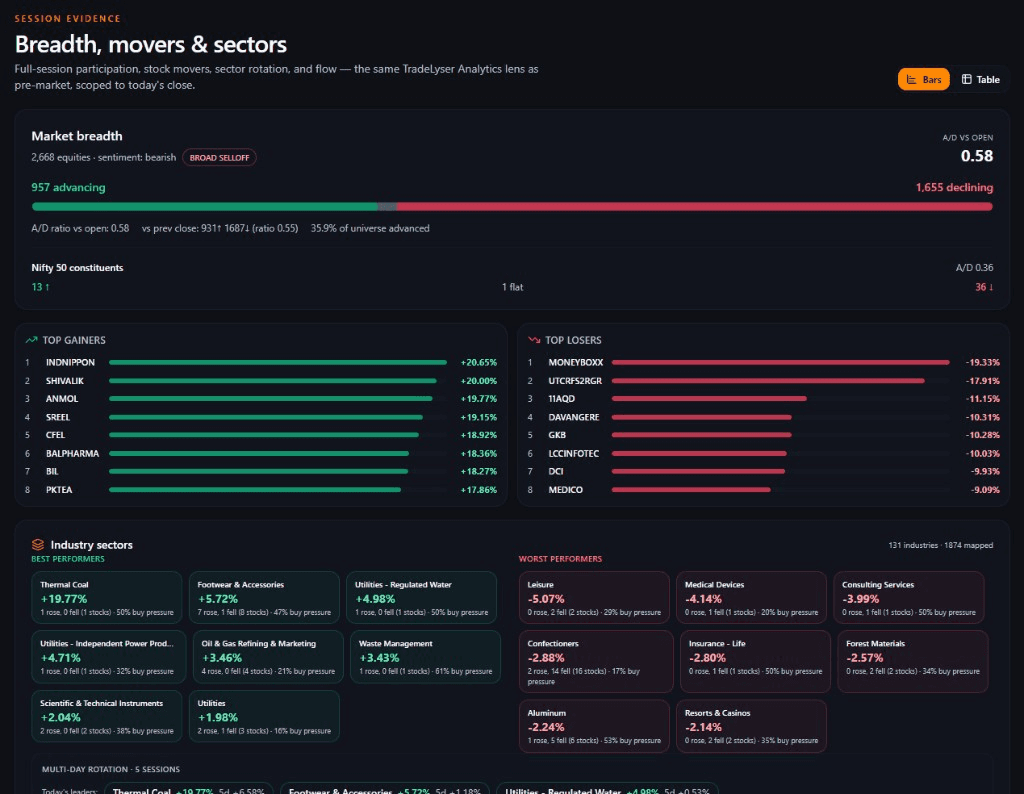
Post-Market — Breadth & Movers

Post-Market — Breadth & Movers

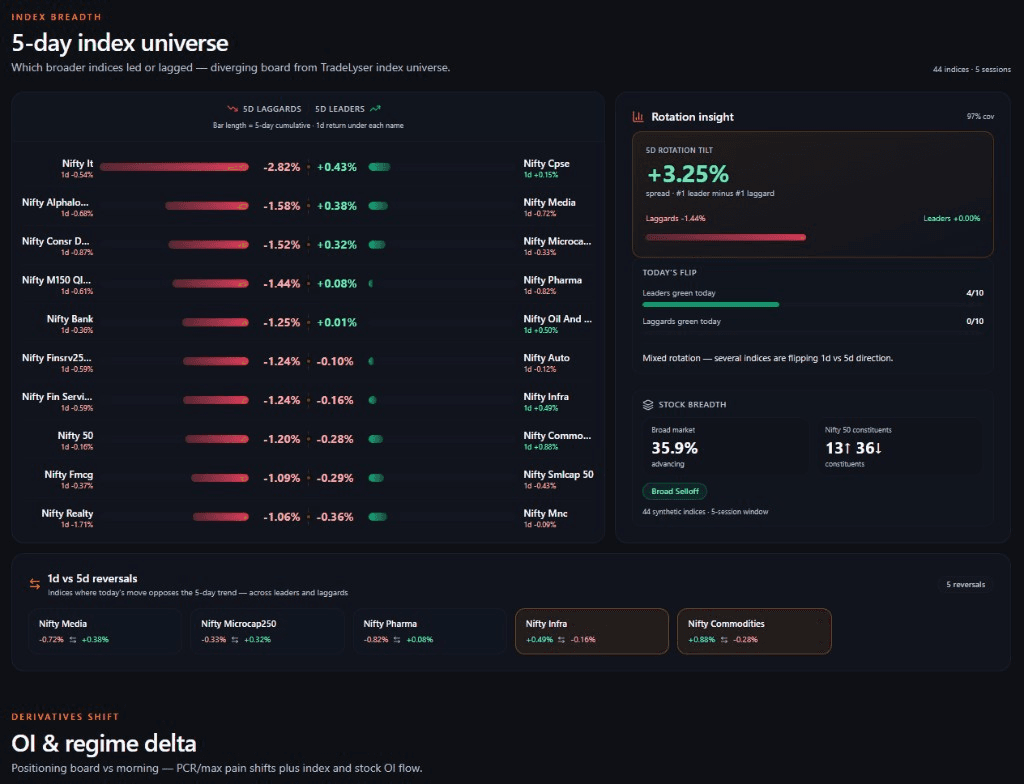
Post-Market — Index Breadth

Post-Market — Index Breadth

Post-Market — Sector & Flow

Post-Market — Sector & Flow

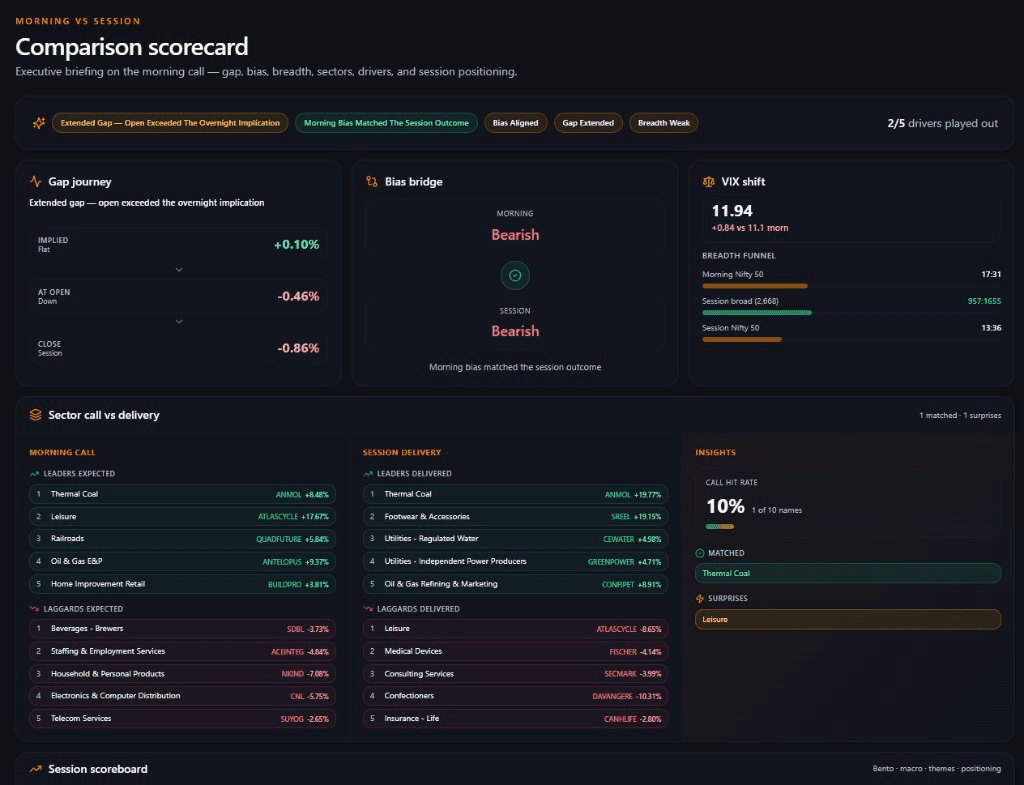
Post-Market — Comparison Scorecard

Post-Market — Comparison Scorecard

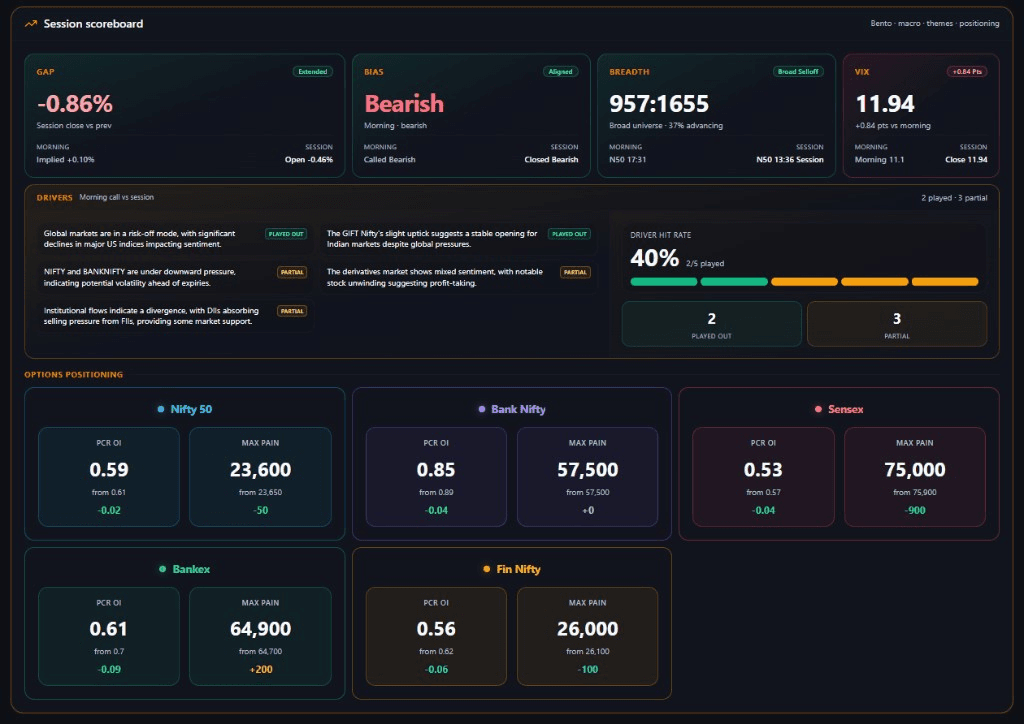
Post-Market — Session Scoreboard

Post-Market — Session Scoreboard

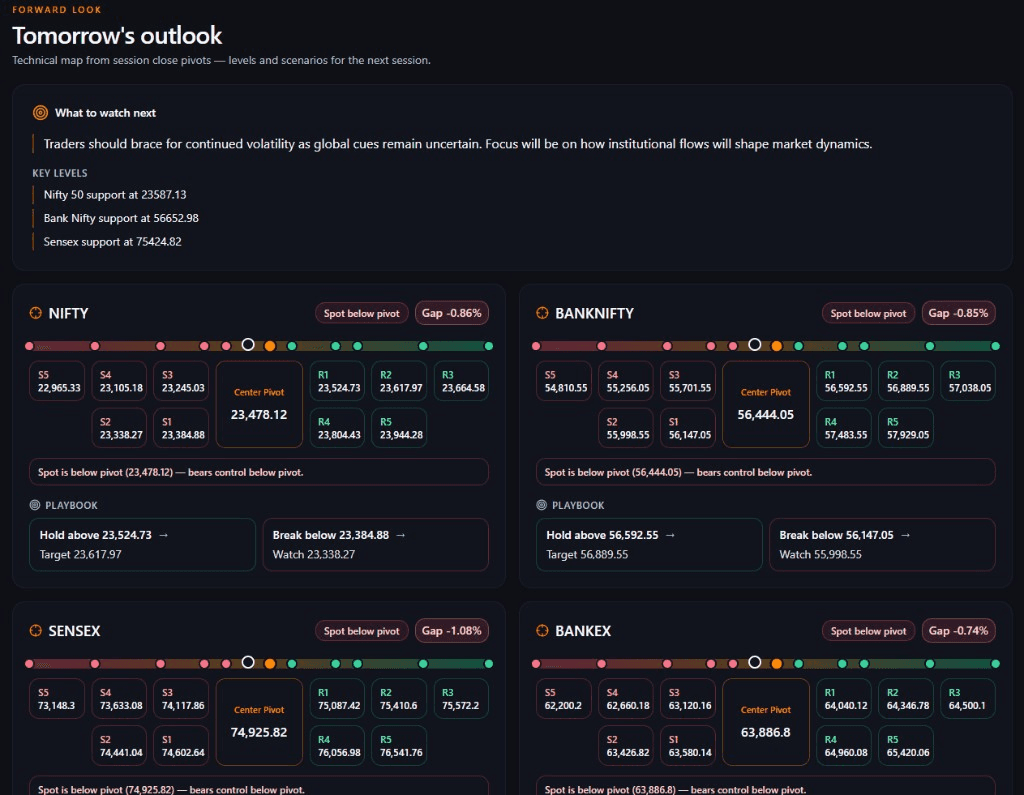
Post-Market — Tomorrow Outlook

Post-Market — Tomorrow Outlook

Published · IST6:30 PMMon–Fri

Post Market

Close the loop after the bell. Post Market compares the day against the morning plan — breadth, sector leadership, derivatives delta, and an expectation-vs-reality scorecard — then hands you a clean next-day outlook.

Use: Replay the session vs the morning call — what worked, what shifted, what to watch tomorrow.

Best for: Active traders reviewing the day and preparing the next session

Core details

  • Session recap
  • Breadth & movers
  • Sector leaders/laggards
  • Derivatives delta
  • Expectation vs reality scorecard
  • Next-day outlook
Published · IST8:00 PM (NSE) / 8:15 PM (BSE)Mon–Fri

Options Expiry

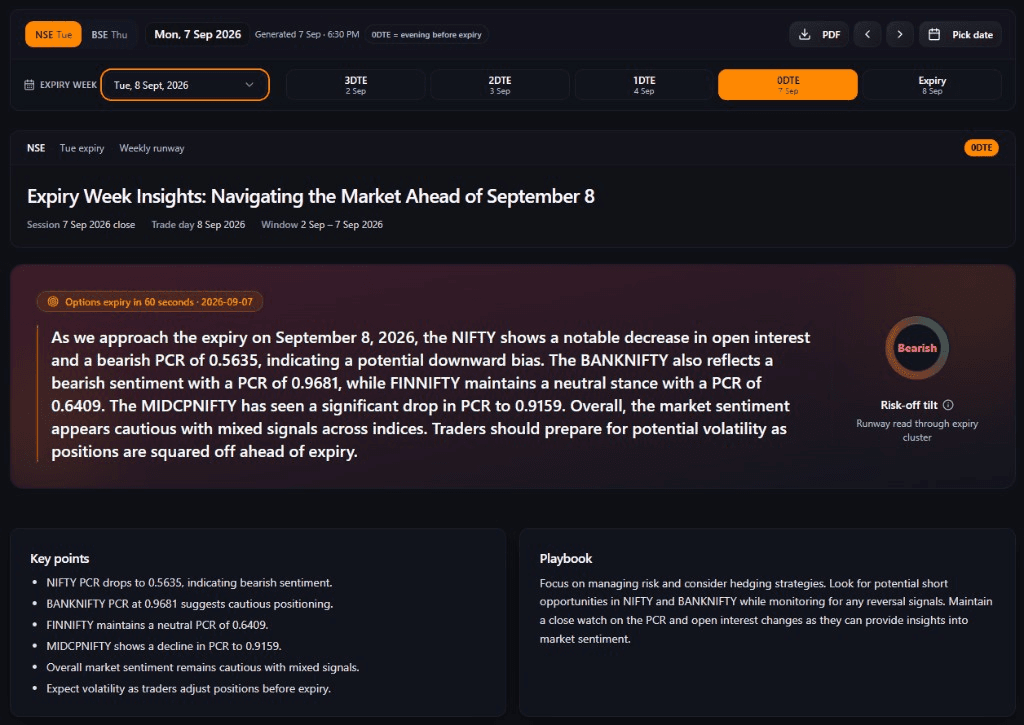
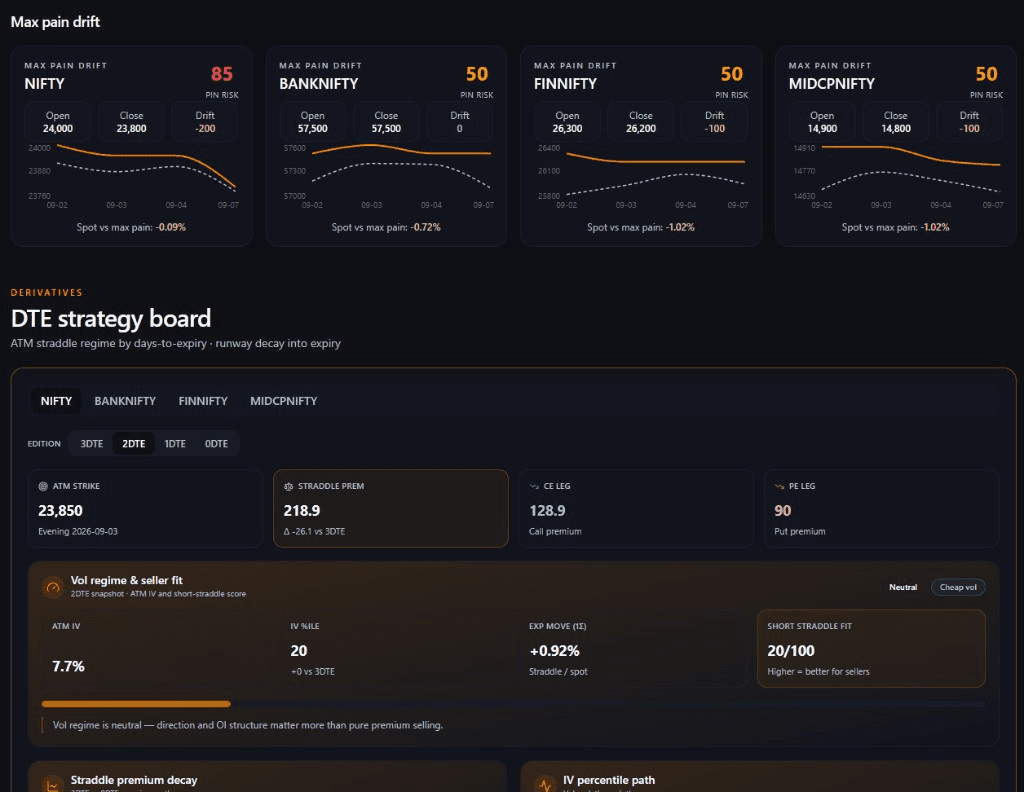
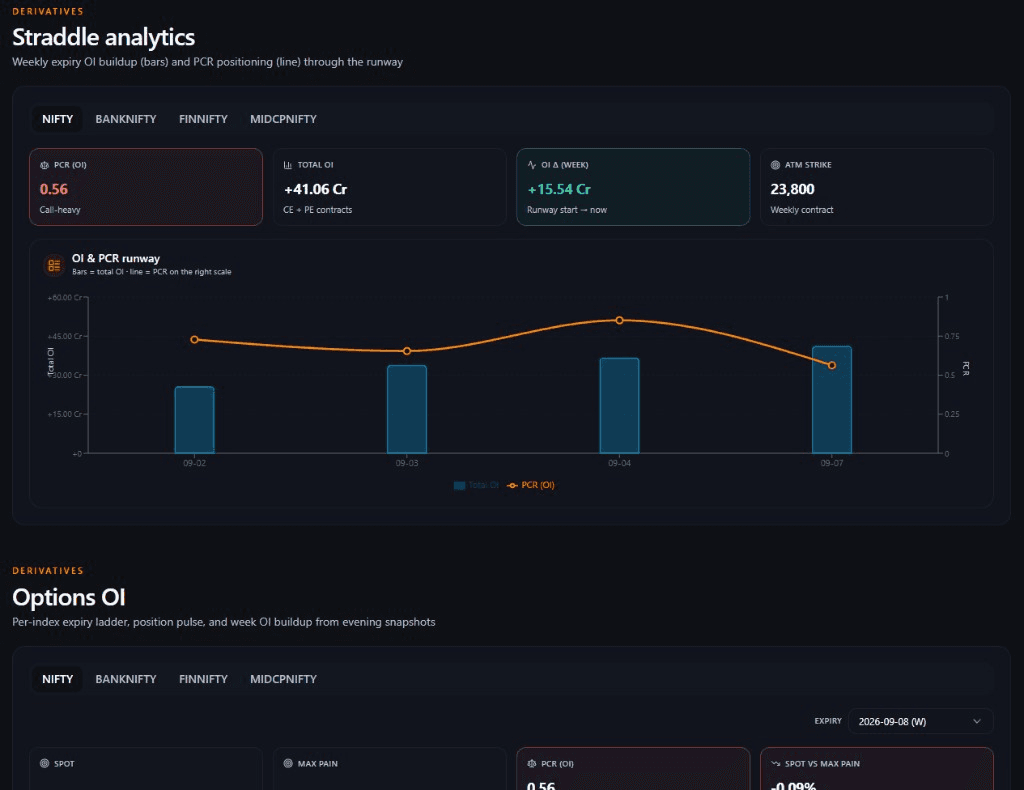
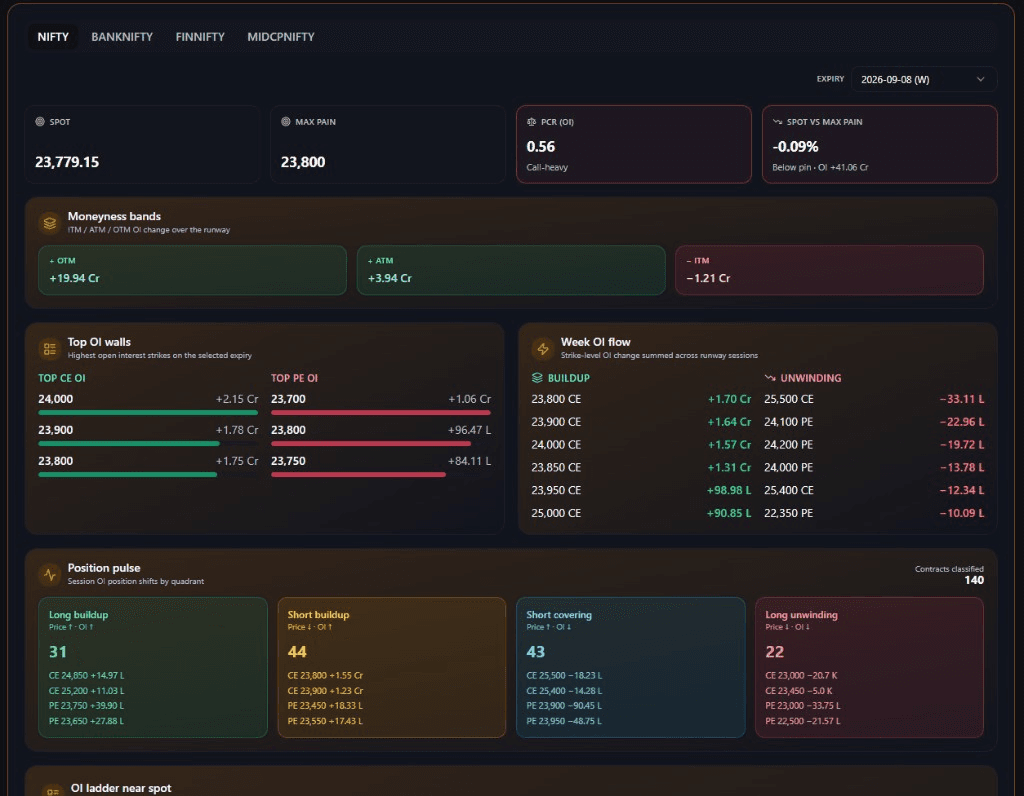
Expiry weeks punish guesswork. Options Expiry maps the cluster calendar, max-pain drift, PCR/OI path, straddle runway, futures rollover, and VIX/IV context so Nifty and Bank Nifty traders can size and time with eyes open.

Use: Navigate expiry-week risk — OI, max pain, rollover, and vol regime for index F&O.

Best for: Options and futures traders around NSE/BSE expiry clusters

Core details

  • Expiry cluster calendar
  • Max pain drift
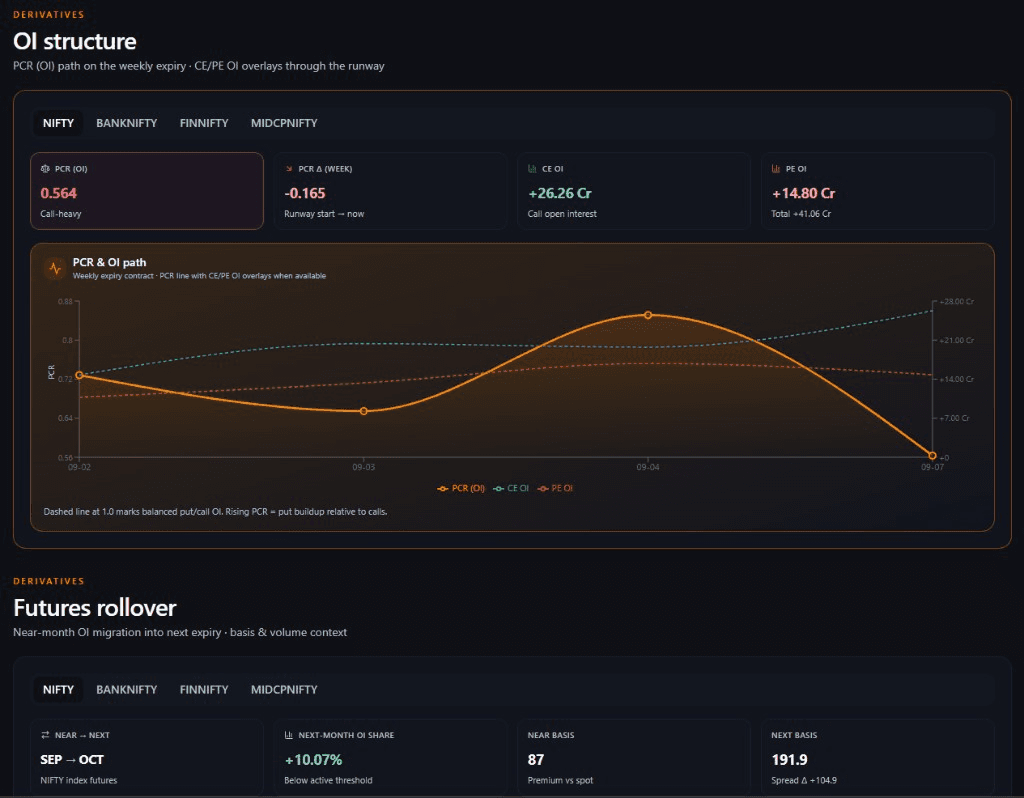
  • PCR / OI path
  • Straddle runway
  • Futures rollover
  • VIX / IV context
Options Expiry — Week Insights

Options Expiry — Week Insights

Options Expiry — Strategy Board

Options Expiry — Strategy Board

Options Expiry — Straddle & OI

Options Expiry — Straddle & OI

Options Expiry — OI Dashboard

Options Expiry — OI Dashboard

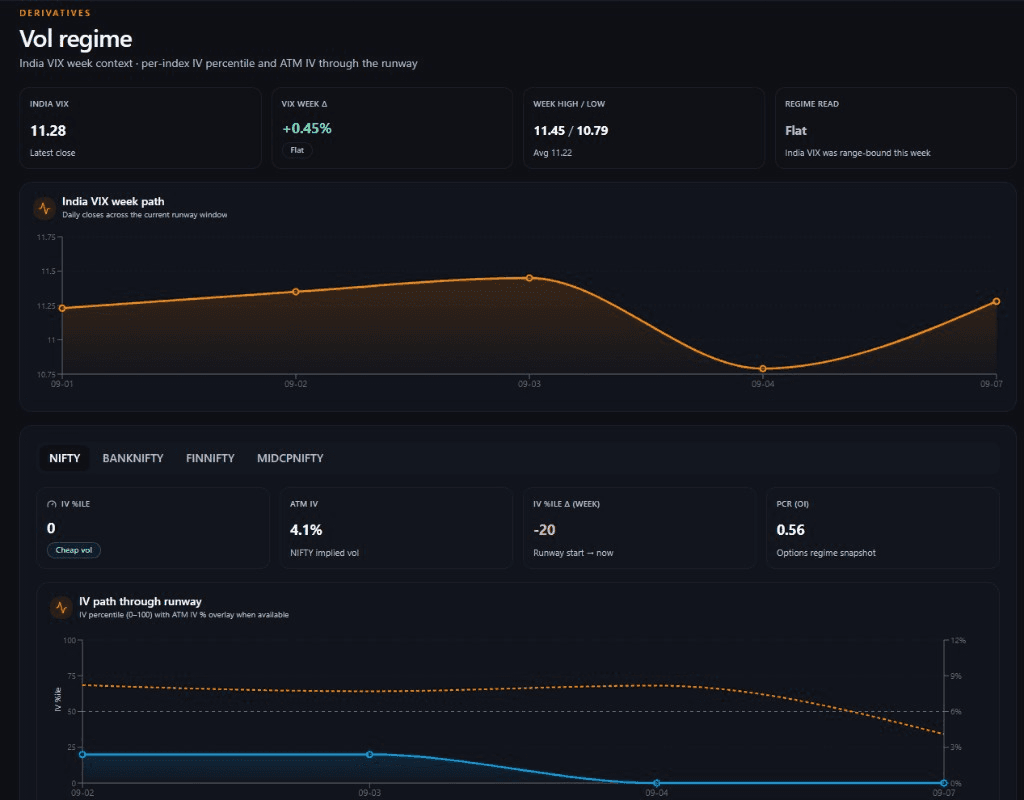
Options Expiry — Vol Regime

Options Expiry — Vol Regime

Options Expiry — OI & Rollover

Options Expiry — OI & Rollover

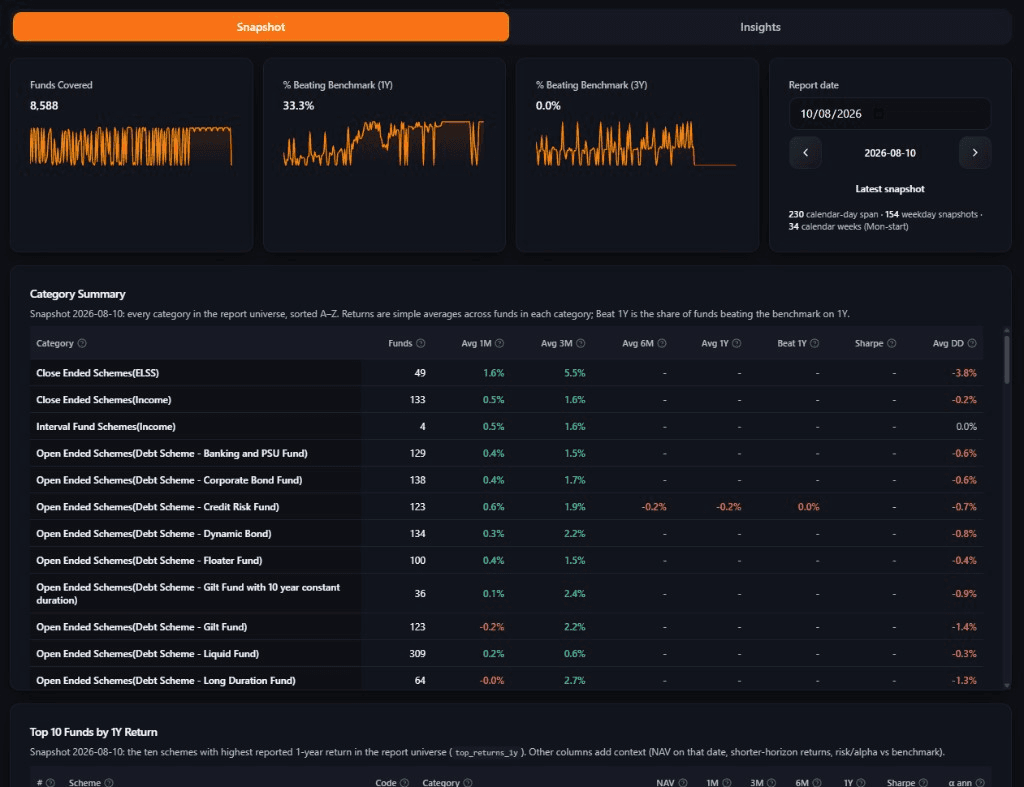
Mutual Funds — Snapshot

Mutual Funds — Snapshot

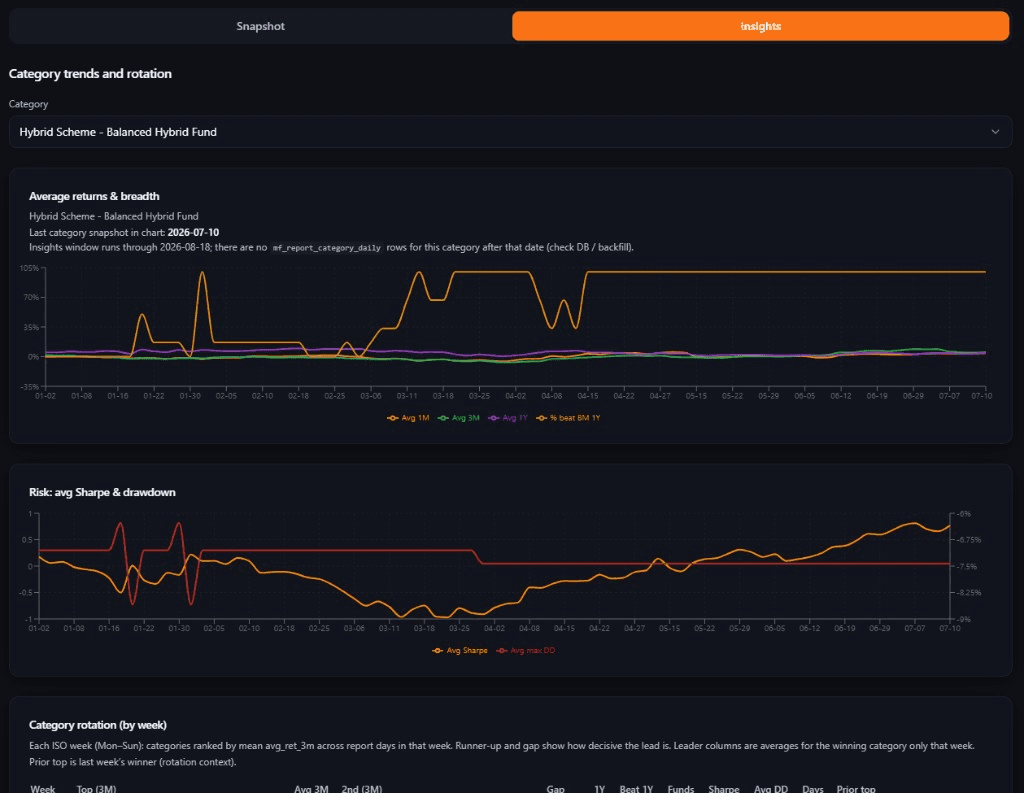
Mutual Funds — Category Insights

Mutual Funds — Category Insights

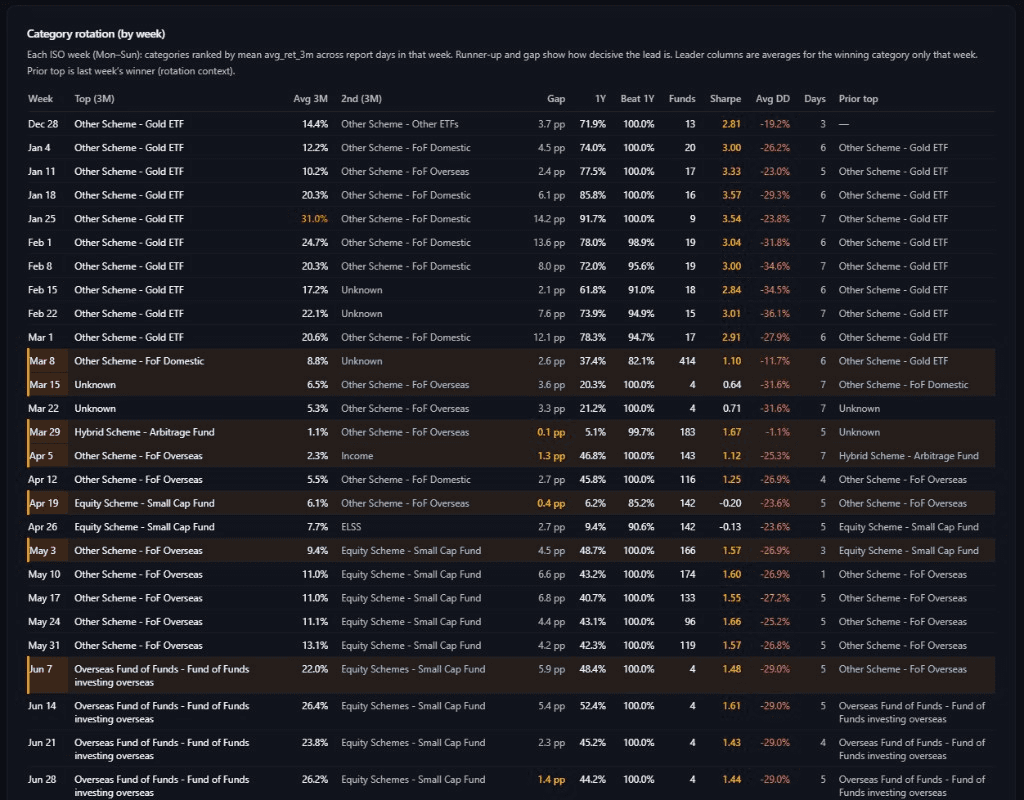
Mutual Funds — Category Rotation

Mutual Funds — Category Rotation

Published · IST9:00 PMDaily

Mutual Funds View

See where patient capital is moving. Mutual Funds View packages the daily AMFI snapshot, category performance, inflow/outflow leaders, and equity-vs-debt tilt — useful context for investors, advisors, and longer-horizon allocators.

Use: Track where retail and SIP money is flowing across MF categories.
Best for: Investors, advisors, and longer-horizon allocators

Core details

  • Daily AMFI snapshot
  • Category performance
  • Inflow / outflow leaders
  • Insight trends
  • Equity vs debt tilt
Published · IST10:00 PMMon–Fri

Institution View

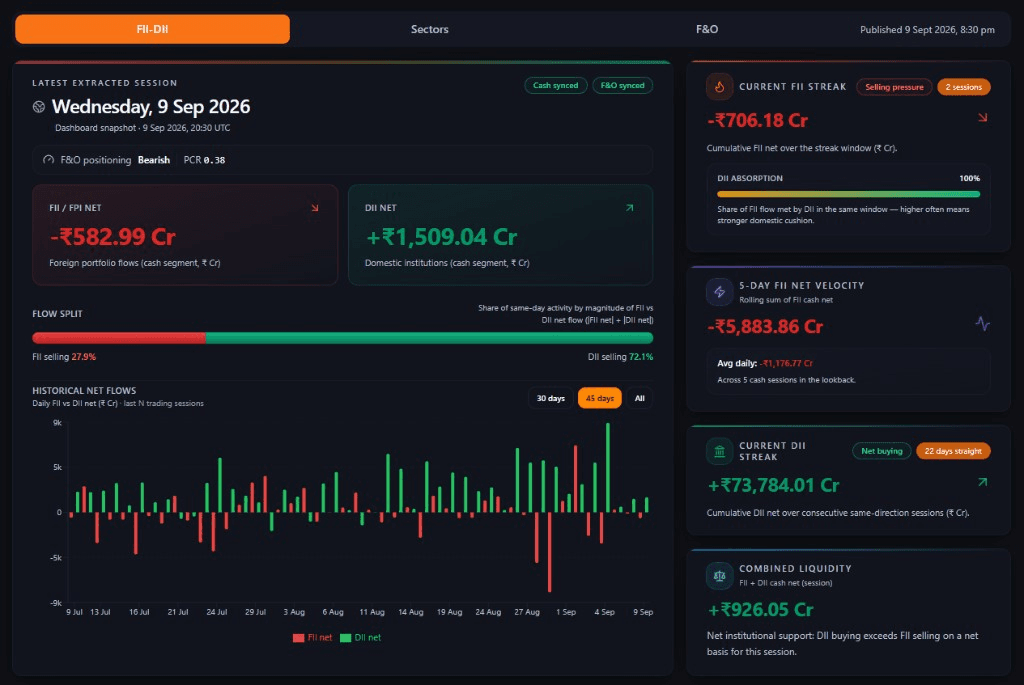
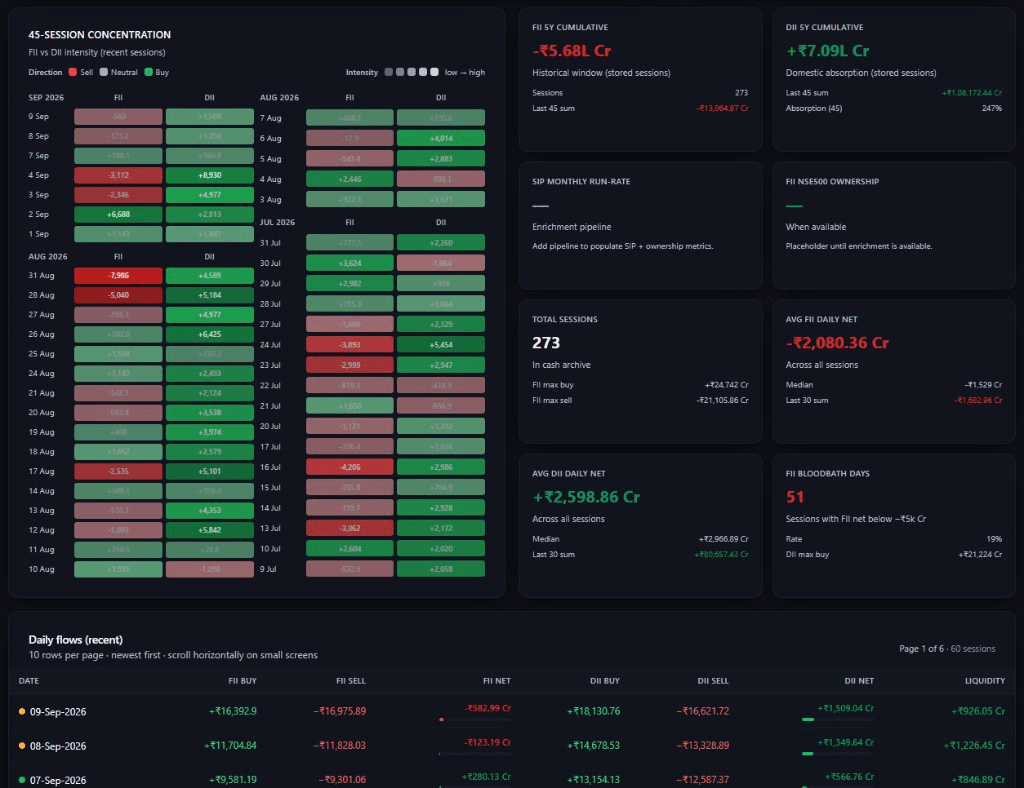
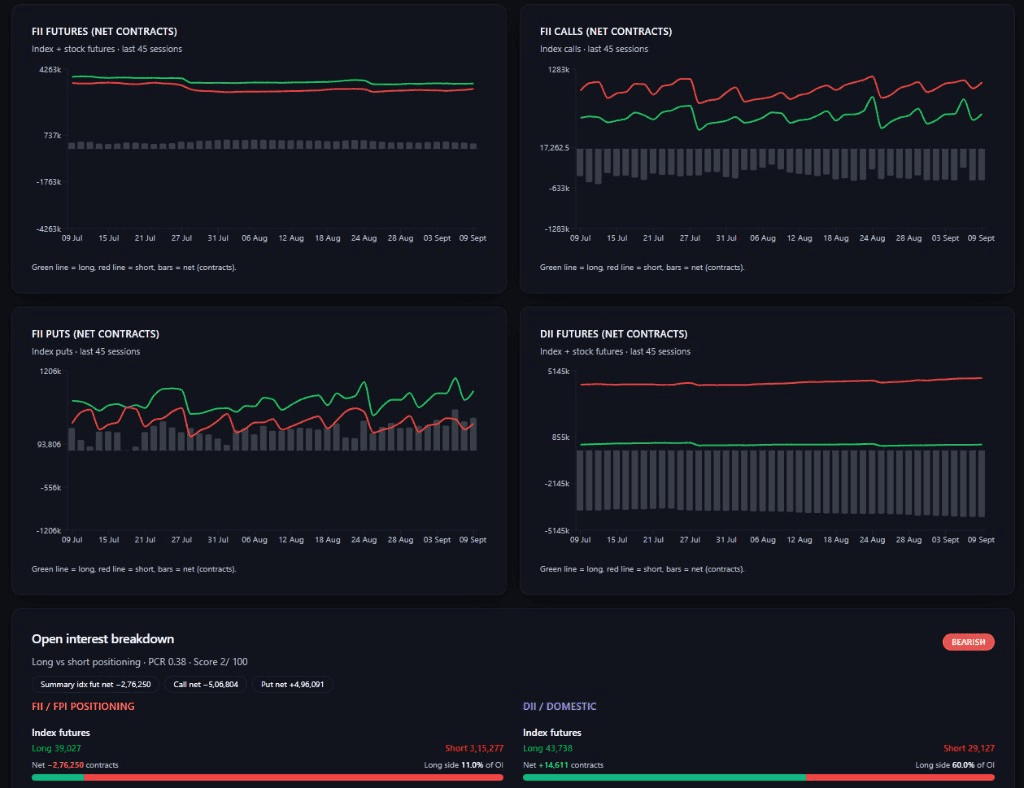
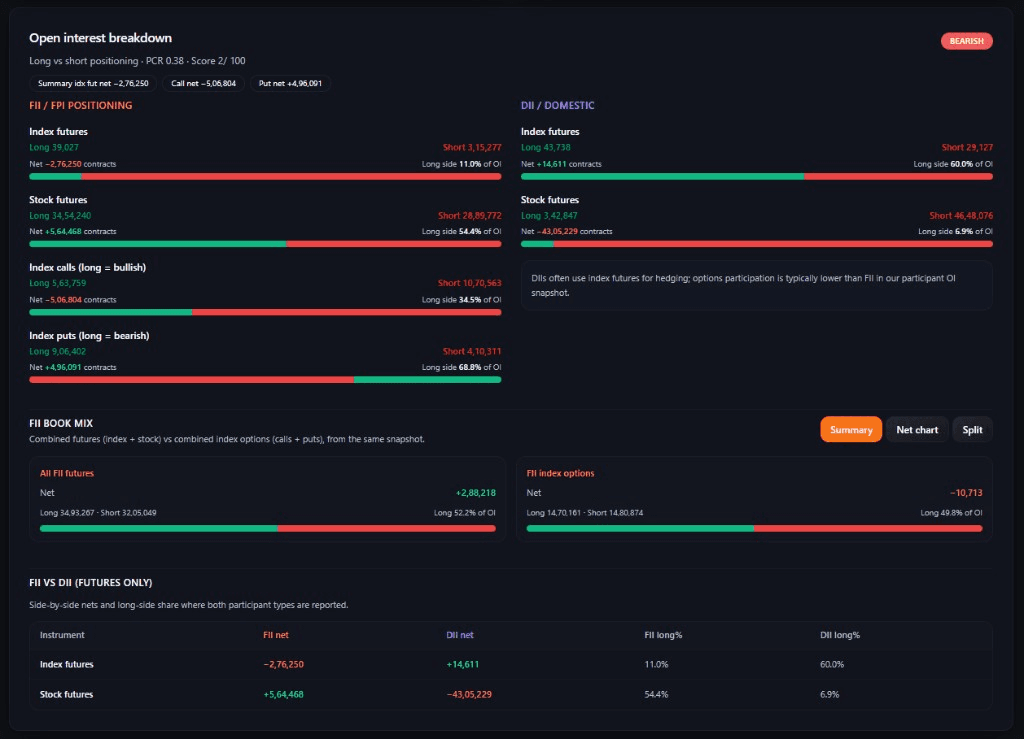
Trade with the tide, not against it. Institution View surfaces FII–DII cash flows, FPI sector allocation, and F&O positioning so swing and positional traders can align with where large participants are actually committed.

Use: See how big money is positioned in cash and F&O.

Best for: Swing traders, positional traders, and anyone trading with the institutional tide

Core details

  • FII–DII cash flows
  • Sector allocation (FPI)
  • F&O positioning
  • Latest published institutional snapshot
Institution View — Overview

Institution View — Overview

Institution View — Cash Flows

Institution View — Cash Flows

Institution View — F&O Positioning

Institution View — F&O Positioning

Institution View — OI Breakdown

Institution View — OI Breakdown

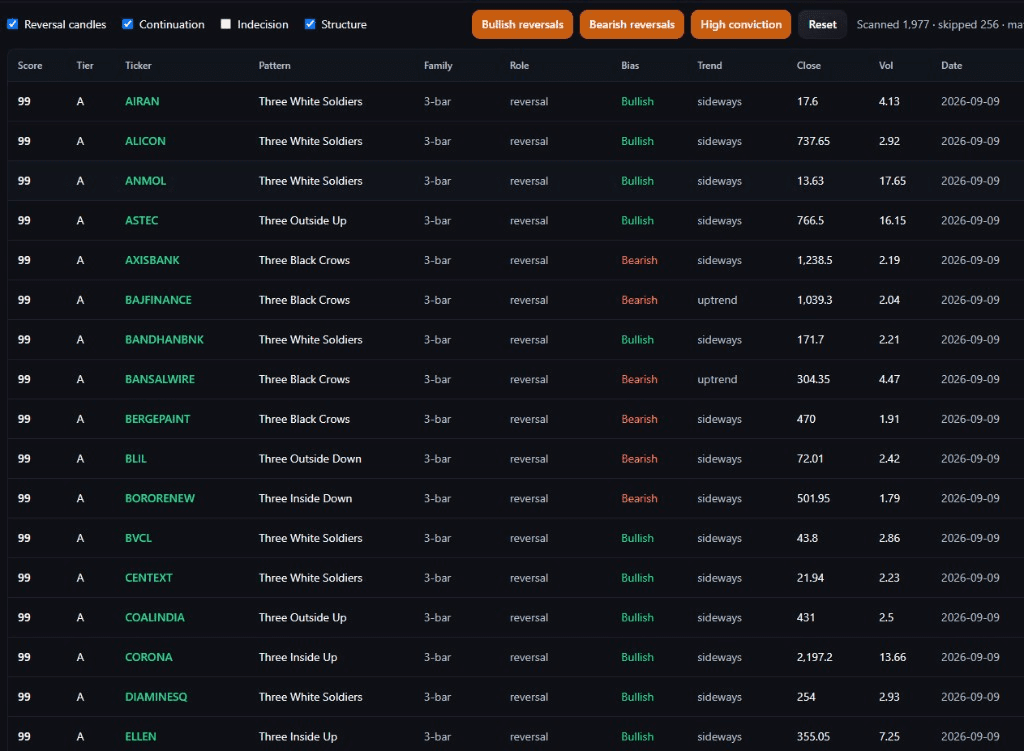
Equity Daily — Pattern Scan

Equity Daily — Pattern Scan

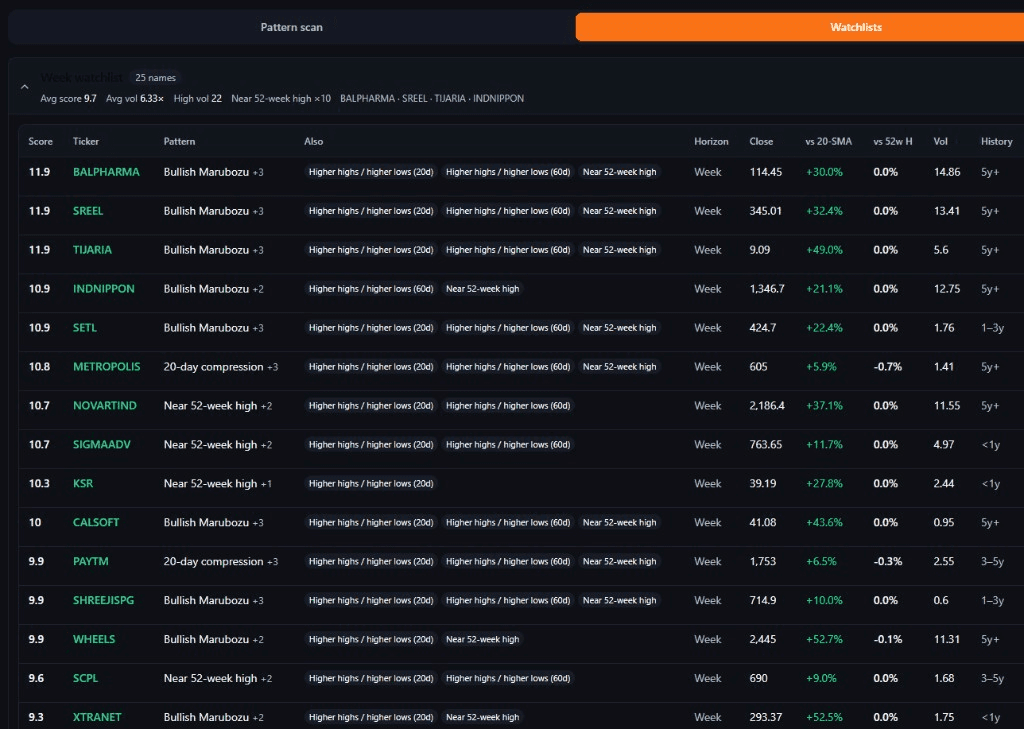
Equity Daily — Week Watchlist

Equity Daily — Week Watchlist

Published · IST~10:40 PMMon–Fri (after 10:30 increment)

Equity Daily

Cut through noise in the cash book. Equity Daily surfaces pattern scans, breakouts and breakdowns, 52-week extremes, compression, and short/long swing lists so day and short-swing traders start from a focused watchlist.

Use: Scan the cash market for actionable setups the same session.

Best for: Equity day traders and short-swing stock traders

Core details

  • Pattern scan
  • Week watchlist
  • Breakouts / breakdowns
  • 52-week highs & lows
  • Compression
  • Short / long swing lists
Published · ISTContinuousRSS ingest ~every 15 minutes

News Intelligence

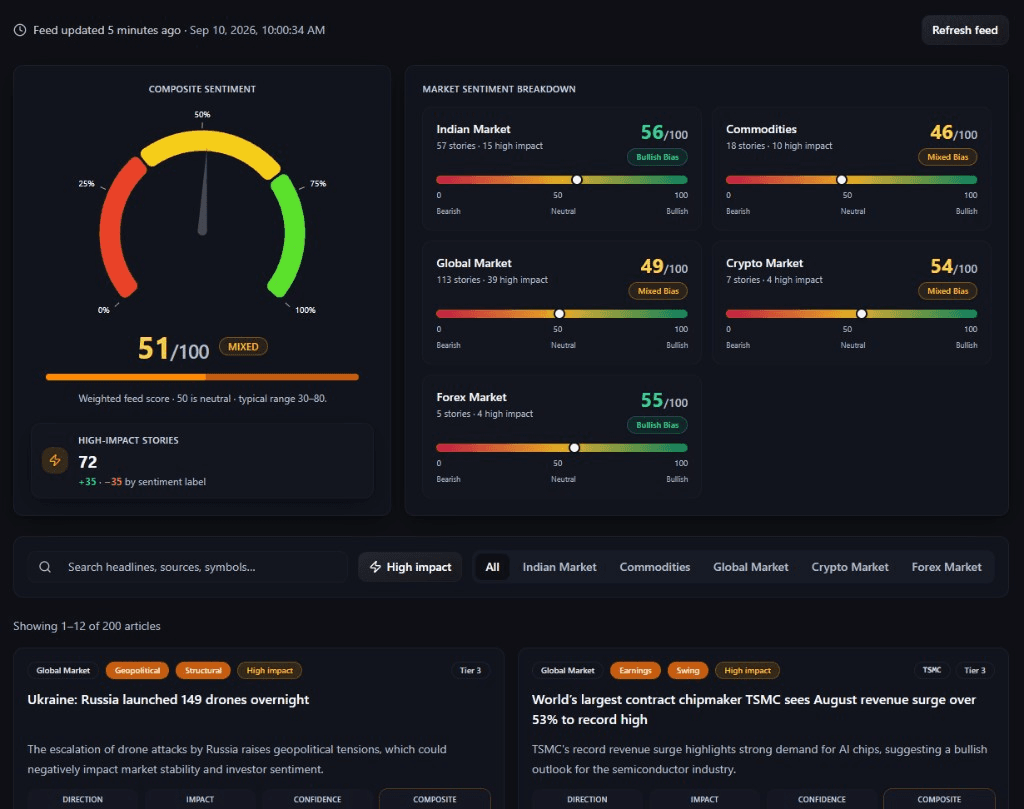
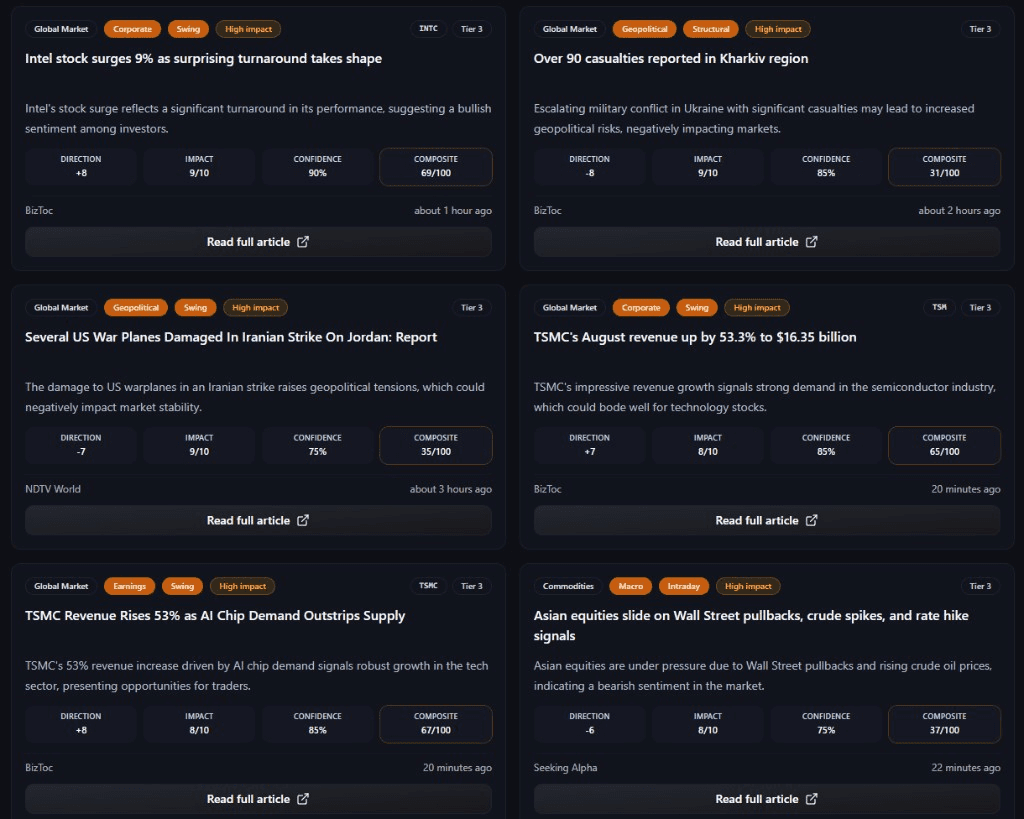
Signal over scroll. News Intelligence ranks stories by multi-factor sentiment, impact, and confidence, with theme filters and a high-impact India focus — so you act on what can move the tape, not every alert.

Use: Filter market news by impact, sentiment, and confidence — not raw headlines.

Best for: All traders who need signal from noise before and during the session

Core details

  • Ranked stories
  • Multi-factor sentiment
  • Impact & confidence scores
  • Theme / category filters
  • High-impact India focus
News Intelligence — Overview

News Intelligence — Overview

News Intelligence — Ranked Feed

News Intelligence — Ranked Feed

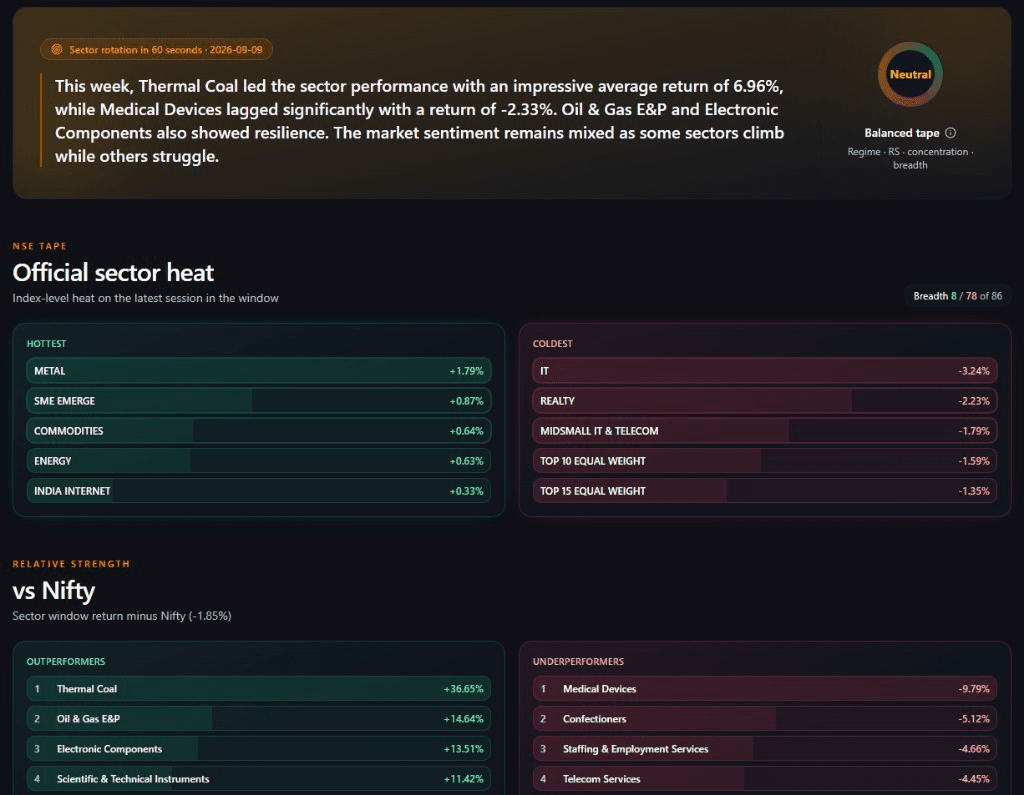
Sector Rotation — Overview

Sector Rotation — Overview

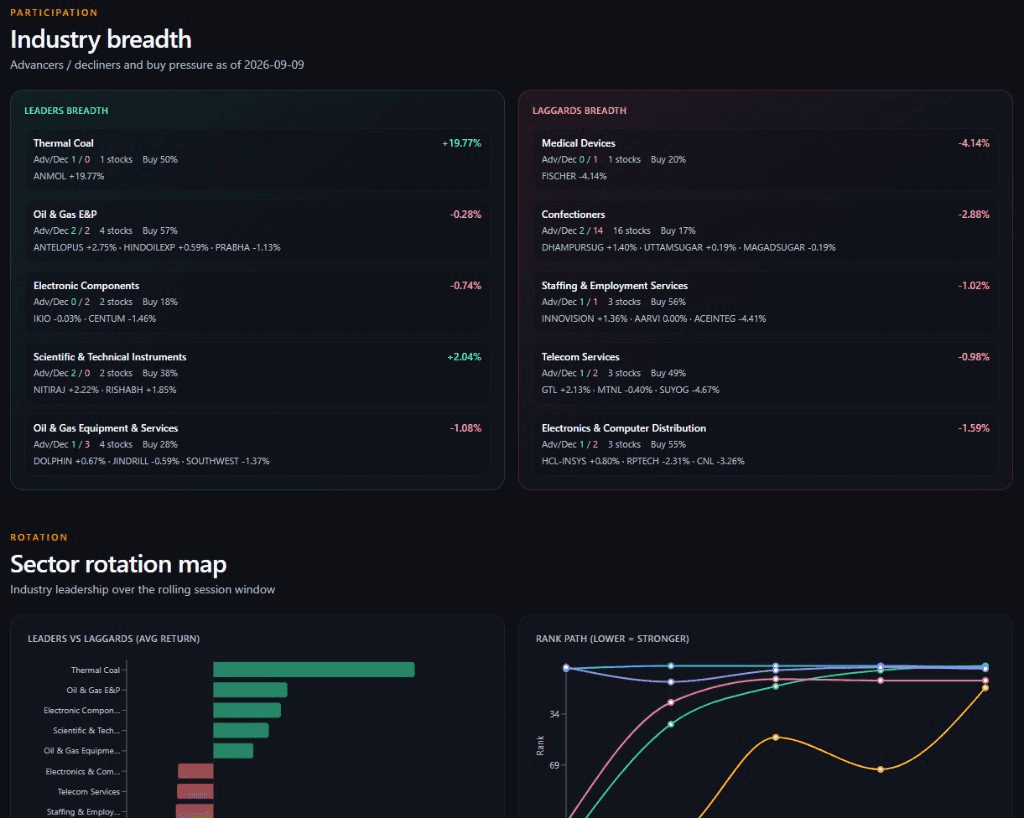
Sector Rotation — Industry Breadth

Sector Rotation — Industry Breadth

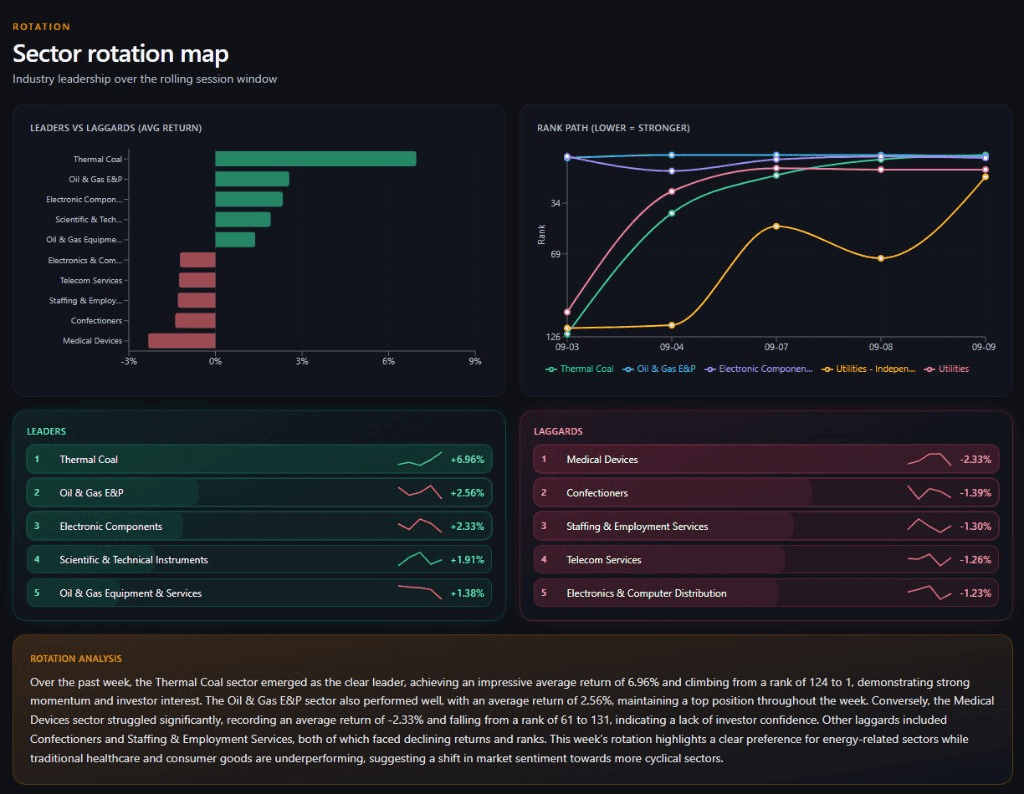
Sector Rotation — Rotation Map

Sector Rotation — Rotation Map

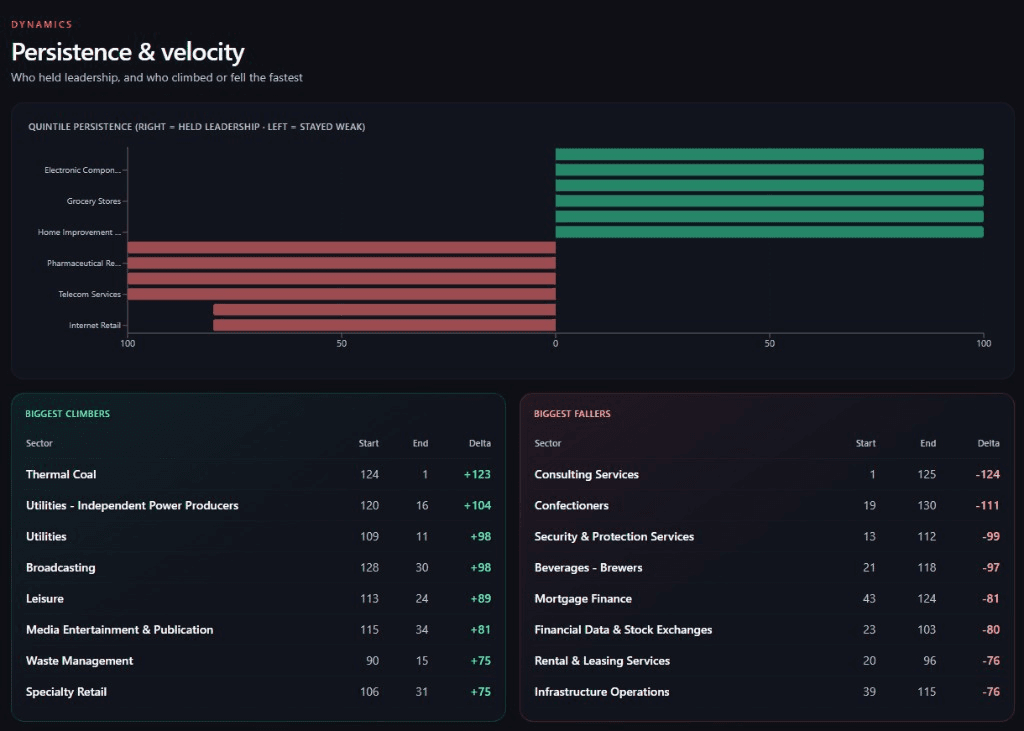
Sector Rotation — Persistence & Velocity

Sector Rotation — Persistence & Velocity

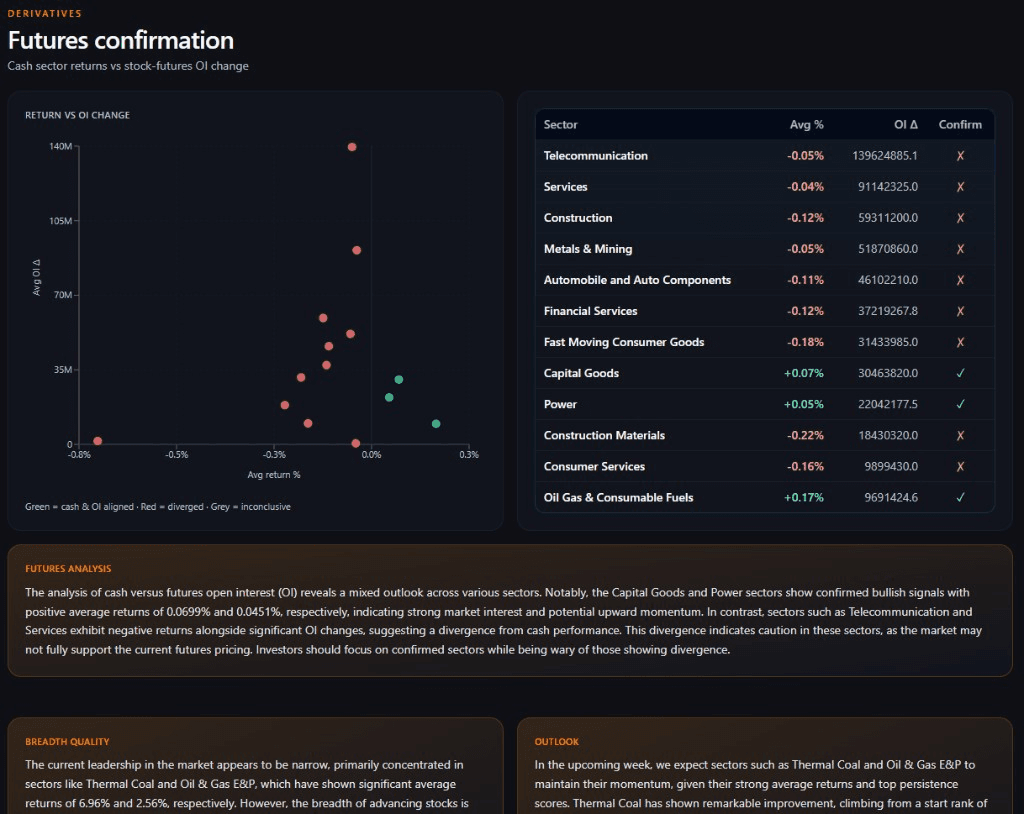
Sector Rotation — Futures Confirmation

Sector Rotation — Futures Confirmation

Published · IST7:30 PMWednesdays

Sector Rotation

Leadership changes before most scanners catch up. Sector Rotation tracks heat, relative strength vs Nifty, persistence, velocity, and futures confirmation so you rotate into strength instead of chasing yesterday’s story.

Use: Spot which sectors are gaining or losing leadership week to week.

Best for: Swing traders, sector rotators, and thematic stock pickers

Core details

  • Sector heat
  • Relative strength vs Nifty
  • Rotation map
  • Persistence & velocity
  • Futures confirmation
  • Breadth outlook
Published · IST9:00 AMSundays

Weekly Market

Plan on a weekly cadence without drowning in daily noise. Weekly Market rolls indices, sectors, global cues, GIFT vs Nifty, derivatives OI, and a watchlist into one brief with next-week bias and risks.

Use: Compress the last five trading days into one brief and set next-week context.

Best for: Swing traders, mentors, and traders who plan on a weekly cadence

Core details

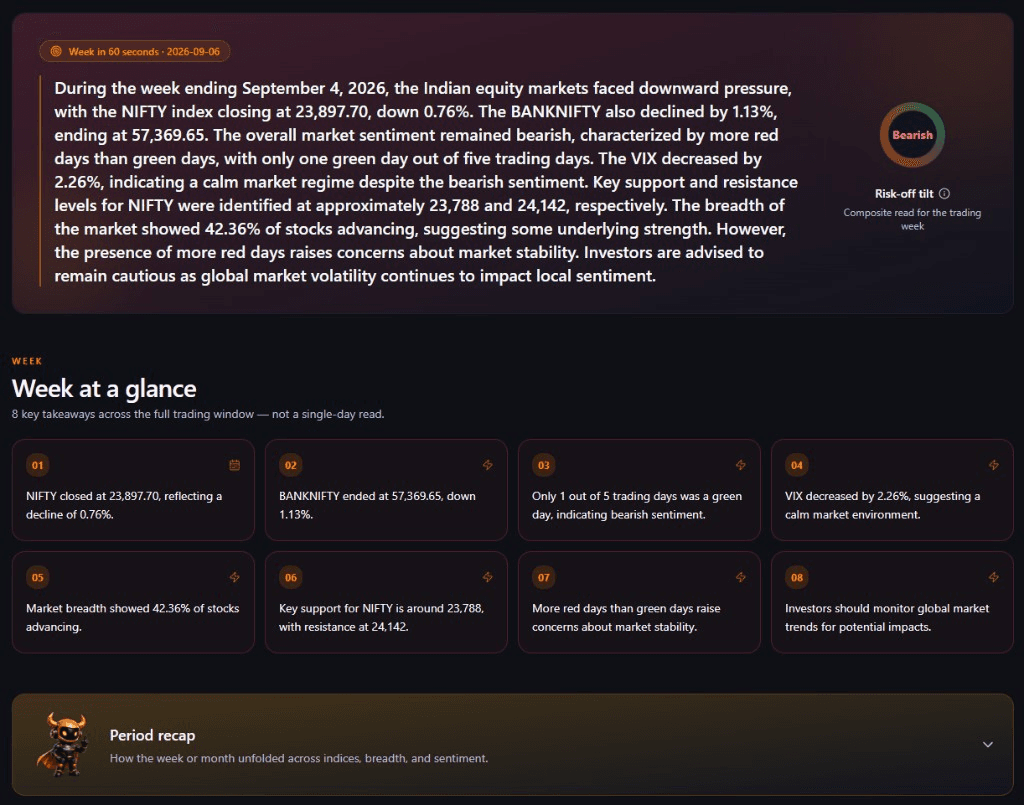
  • Week summary
  • Indian indices
  • Sector performance
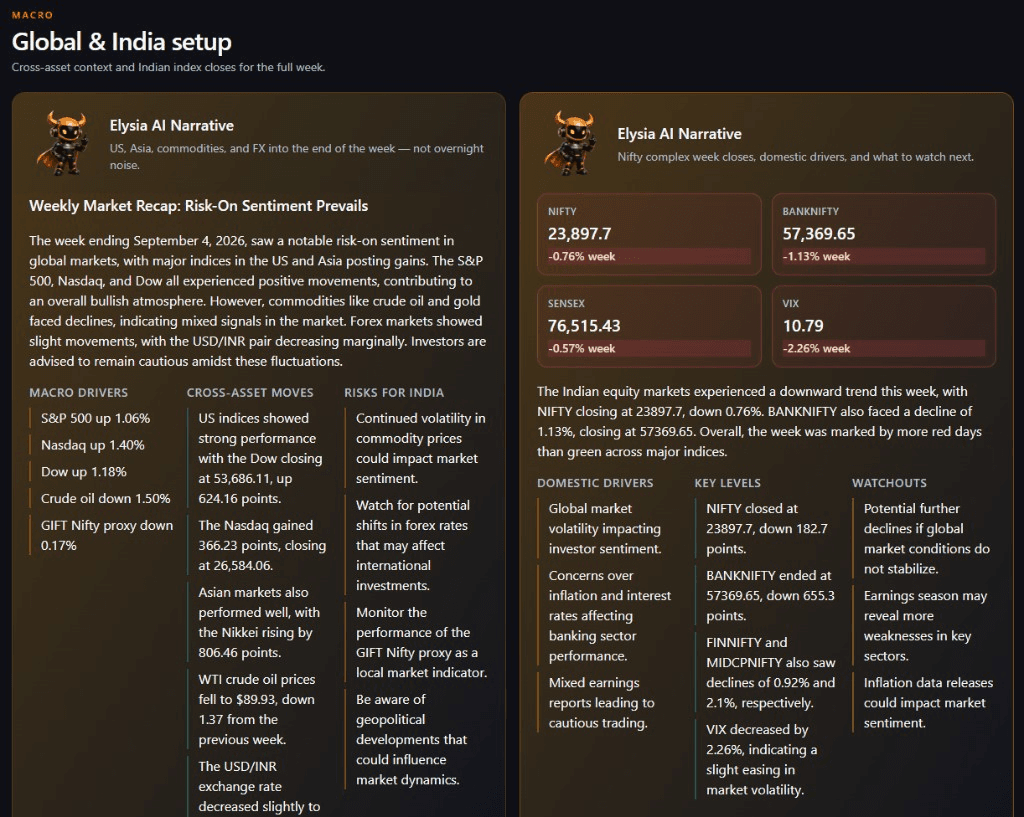
  • Global cues
  • GIFT vs Nifty
  • Watchlist
  • Derivatives OI
  • Next-week bias & risks
Weekly Market — Overview

Weekly Market — Overview

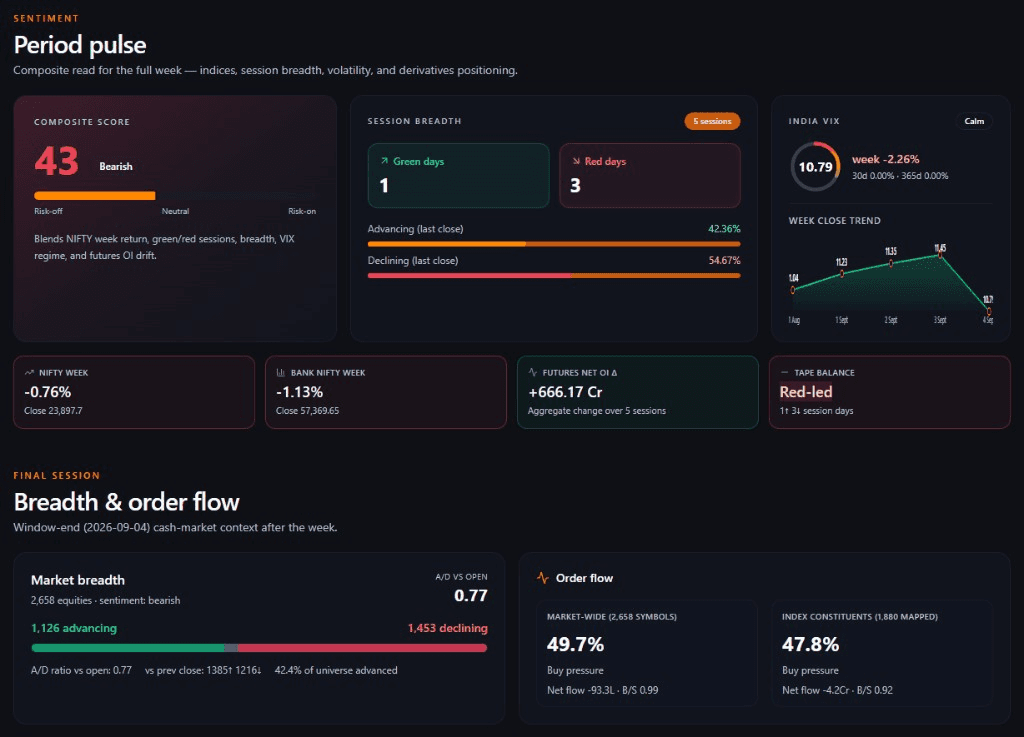
Weekly Market — Period Pulse

Weekly Market — Period Pulse

Weekly Market — Global & India

Weekly Market — Global & India

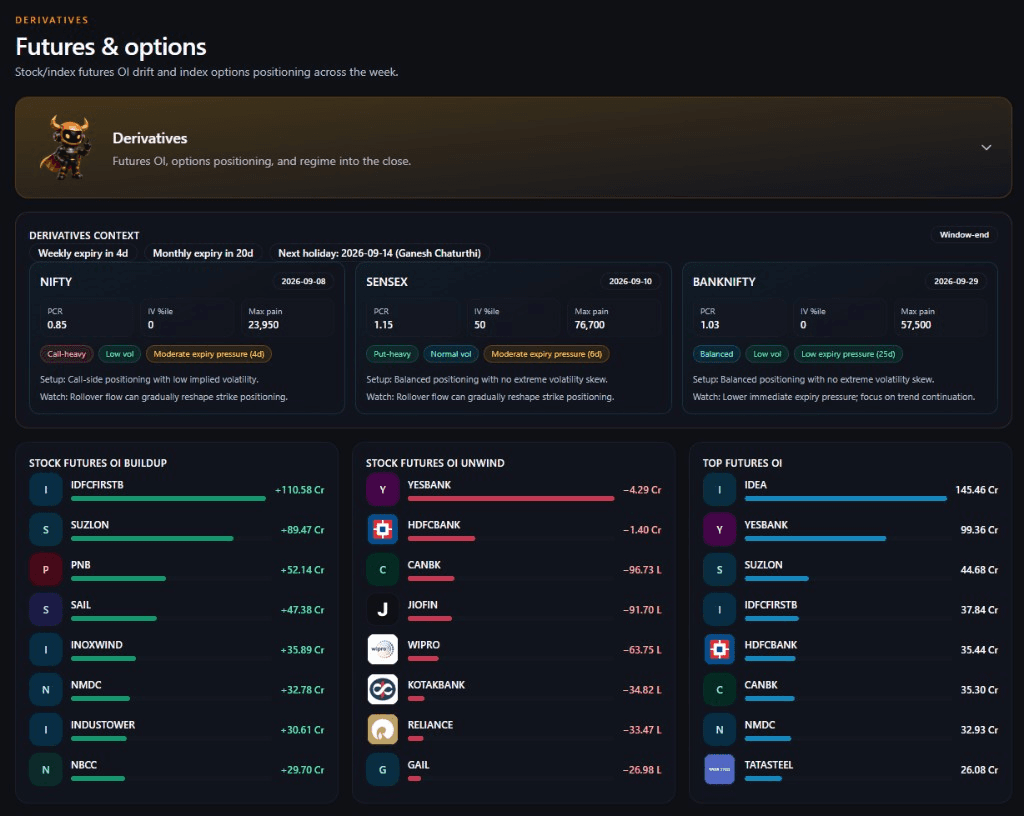
Weekly Market — Derivatives

Weekly Market — Derivatives

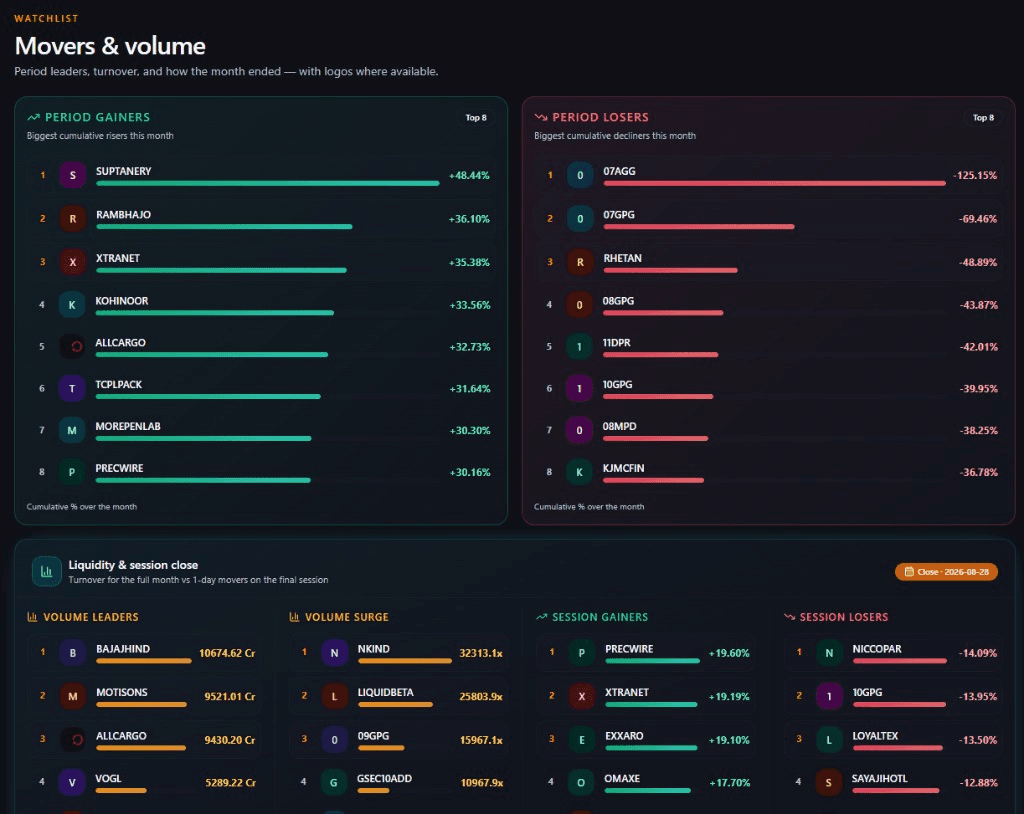
Monthly Market — Movers & Volume

Monthly Market — Movers & Volume

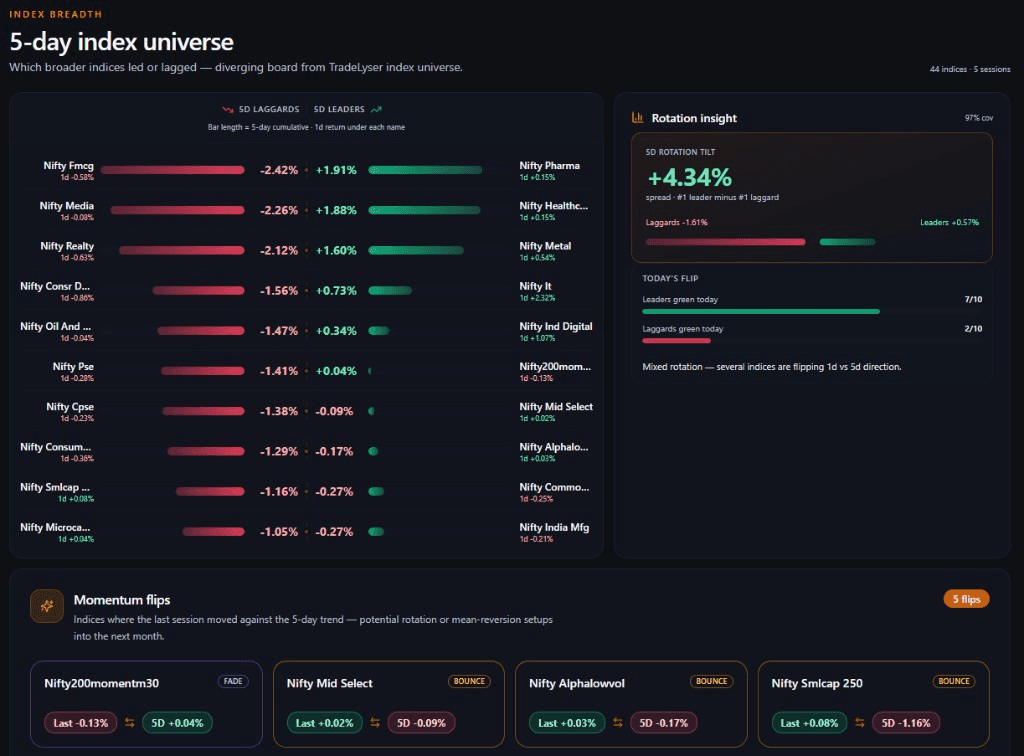
Monthly Market — Index Breadth

Monthly Market — Index Breadth

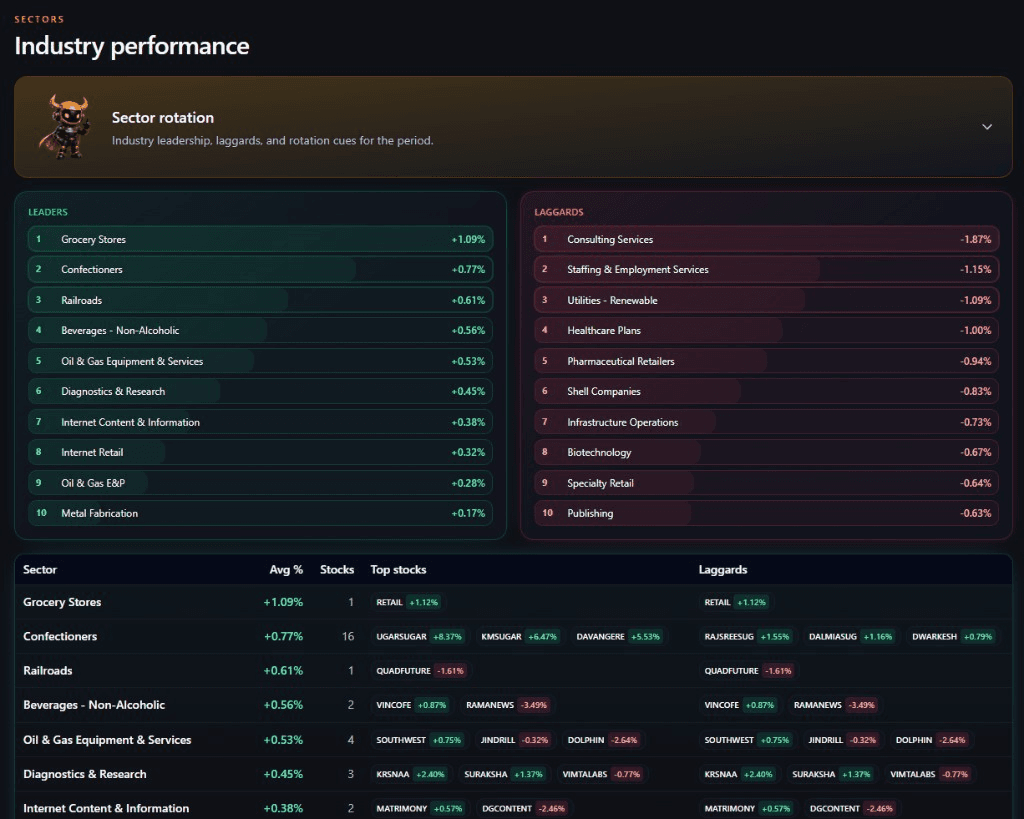
Monthly Market — Industry Performance

Monthly Market — Industry Performance

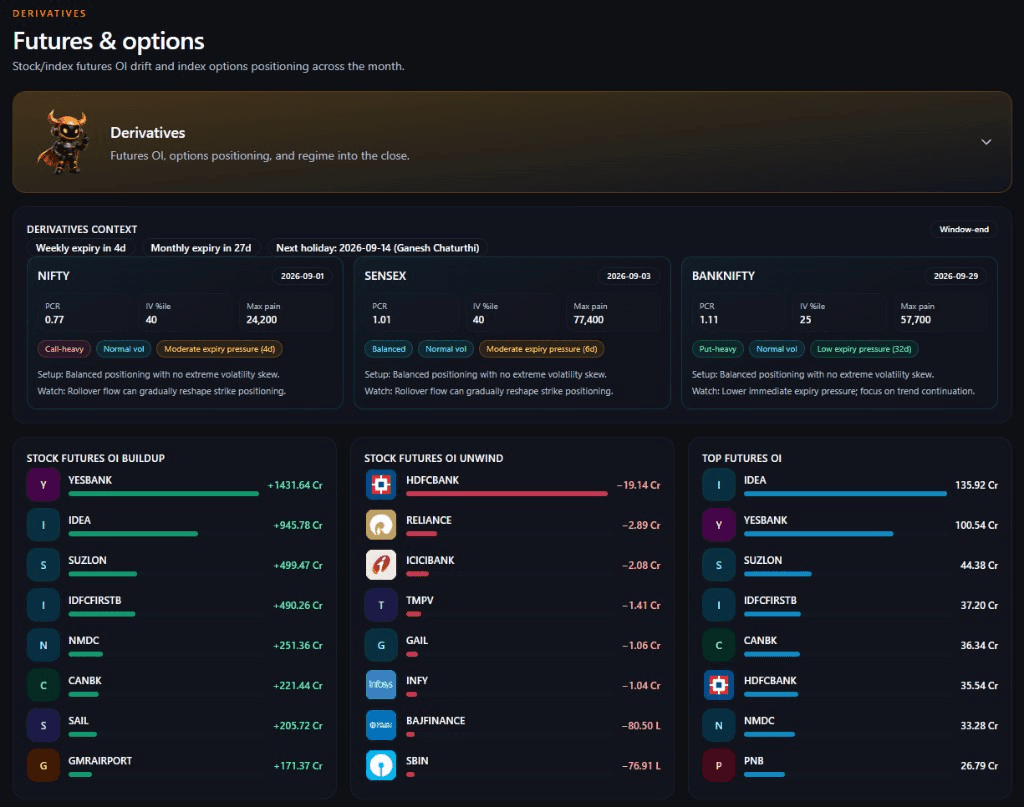
Monthly Market — Derivatives

Monthly Market — Derivatives

Published · IST9:00 AMLast Sunday of the month

Monthly Market

Zoom out for regime, not noise. Monthly Market covers return and drawdown, sector rotation, trend-vs-chop character, the macro that defined the month, and a forward outlook for positional books and strategy reviews.

Use: Frame the month’s regime — returns, rotation, and setup into the next month.

Best for: Positional traders, portfolio managers, and strategy reviewers

Core details

  • Monthly return & drawdown
  • Sector rotation
  • Regime (trend vs chop)
  • Macro that defined the month
  • Next-month outlook

A TRADING DAY

What lands when — in one glance

Follow the IST publish flow from open through the evening, then weekly and monthly at the end.

Session day

Open → close → late briefs

IST · Mon–Fri focus

Week & month

Cadence beyond the session

Wed · Sun · month-end

Job start times in IST · report appears shortly after · tap any stop to jump to details

FAQ

Market Reports FAQs

Common questions about TradeLyser’s Indian market report suite.

What market reports does TradeLyser offer for Indian traders?

TradeLyser Market Reports cover Pre Market, Post Market, Institution View, Options Expiry, Sector Rotation, Equity Daily, Mutual Funds View, Weekly Market, Monthly Market, and News Intelligence — built for NSE and BSE context.

Who should use Pre Market vs Post Market reports?

Use Pre Market to build bias before 9:15 with global cues, levels, and derivatives. Use Post Market after the close to recap the session, sector leaders, and next-day outlook.

What time are TradeLyser market reports published?

All times are IST (job start; the report appears shortly after). Pre Market at 8:15 AM, Post Market at 6:30 PM, Options Expiry around 8:00–8:15 PM, Mutual Funds at 9:00 PM, Institution View at 10:00 PM, Equity Daily ~10:40 PM Mon–Fri. Sector Rotation lands Wednesdays 7:30 PM; Weekly Market Sundays 9:00 AM; Monthly Market on the last Sunday at 9:00 AM. News Intelligence updates continuously.

Do TradeLyser reports cover F&O expiry and institutional flows?

Yes. Options Expiry maps OI, max pain, rollover, and vol regime around expiry clusters. Institution View tracks FII–DII cash flows, FPI sector allocation, and F&O positioning.

Are Weekly and Monthly Market reports available?

Yes. Weekly Market compresses the last five sessions into one brief with next-week bias (Sundays 9:00 AM IST). Monthly Market frames the month’s regime, rotation, and outlook (last Sunday of the month, 9:00 AM IST).

What is Equity Daily used for?

Equity Daily scans the cash market for same-session setups — pattern scans, breakouts and breakdowns, 52-week highs and lows, compression, and short/long swing lists for day and short-swing stock traders.

How does News Intelligence differ from a normal news feed?

News Intelligence ranks stories by multi-factor sentiment, impact, and confidence — with theme filters and a high-impact India focus — so you act on what can move the tape instead of scrolling raw headlines.

Can I use Market Reports with my TradeLyser trading journal?

Yes. Reports give session and regime context; your journal captures executions, tags, and discipline. Many traders open Pre/Post Market around the session and review Weekly or Monthly briefs alongside journal analytics.

Trade with context — from open to monthly regime

Open TradeLyser Market Reports for pre/post briefs, F&O expiry maps, sector rotation, equity setups, fund flows, and news that actually moves India.

Part of your trading journal