
Your equity curve is your account balance plotted trade by trade, after brokerage, STT and other charges. It is the most honest chart you own, because it already includes every rule you broke and every good trade you skipped. The trouble is that most traders look at one curve for the whole account, where a strategy that works can hide one that does not.
This guide covers how to read the shape of that curve, how to set drawdown limits before you need them, and what to do when a strategy crosses one.
Three shapes to recognise
Split your curve by strategy tag and most of them fall into one of three shapes. Each one asks for a different decision.
A grind is what a working edge usually looks like: progress with small dips that recover within a few sessions. Stagnation is common on high-frequency options strategies, where the setup may be fine before costs and flat after them. A cliff is almost always one or two trades taken at the wrong size, often on an expiry day, rather than a problem with the setup itself.
Set drawdown tiers before you need them
Decide your limits on a calm weekend, write them in your trading plan, and treat them as rules rather than feelings. Measure drawdown from your last equity peak, as a percentage of the capital you have given that strategy. Percentages let you compare a ₹50,000 scalping tag with a ₹5,00,000 swing tag on the same scale.
These numbers are a starting point, not a standard. A strategy with a long history of 8% dips needs wider bands than a new one. What matters is that the bands exist in writing before the drawdown starts, so the decision is already made when you are under pressure.
Worked example: a Nifty options strategy
Here is an illustrative case. A trader runs a Nifty weekly options breakout strategy with ₹2,00,000 allocated to it. After 46 trades, the curve for that tag looks like this:
The useful part of this example is what did not happen. The trader did not abandon the strategy after the first bad week, and did not double size to win the loss back. The Tier 2 rule forced a smaller position and a review, the review found the actual cause, and the strategy recovered at normal size once the expiry-day sizing rule was fixed.
How to read it in TradeLyser
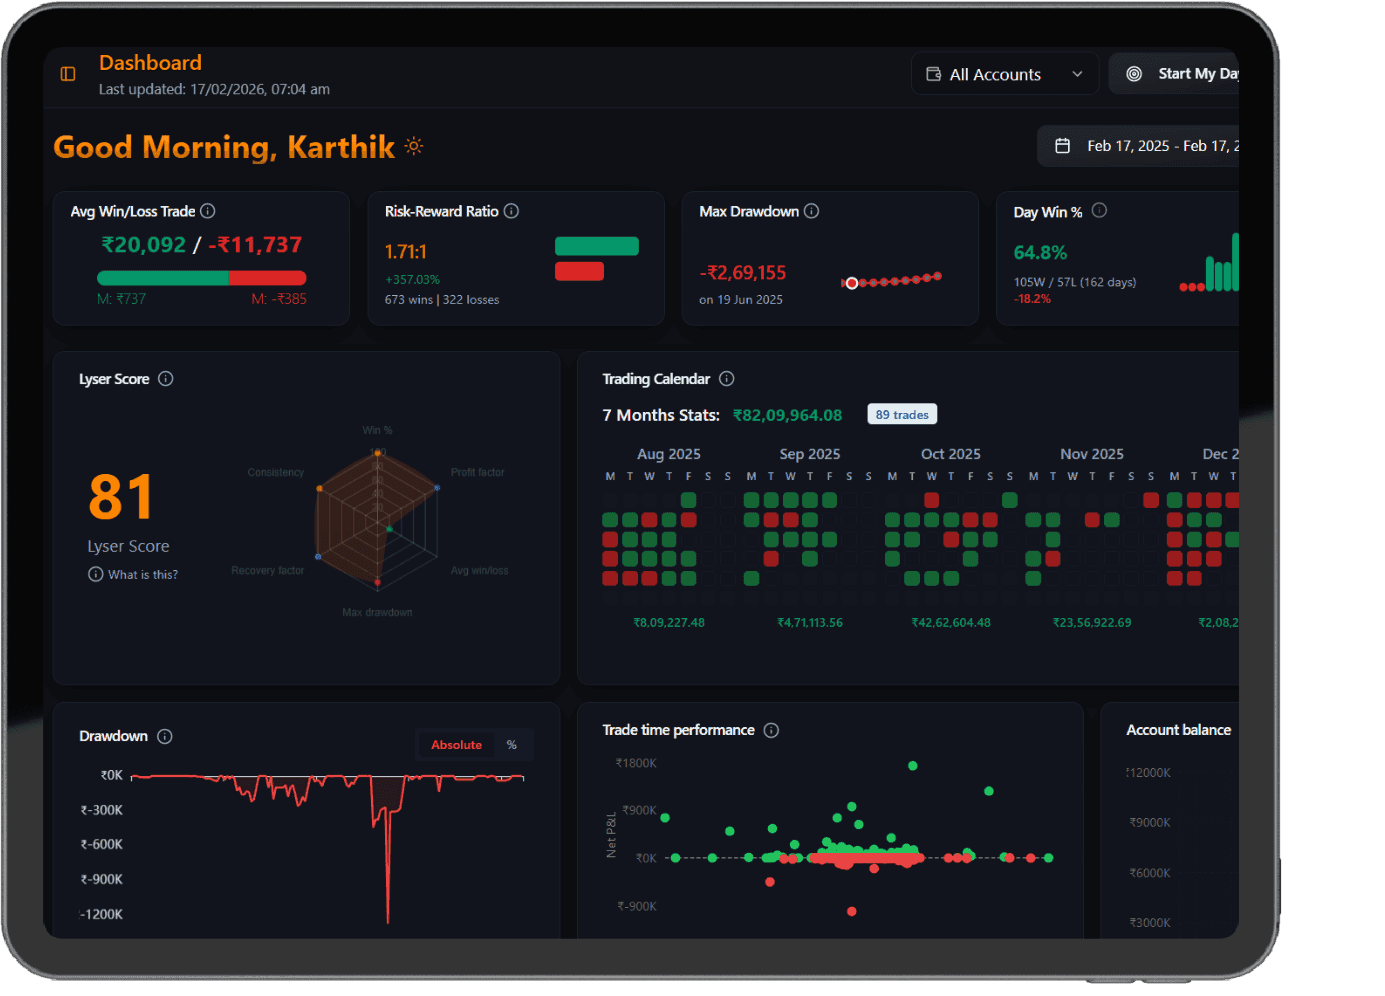
- Open Analytics and filter by a single strategy tag.
- Switch the drawdown chart to % and note the deepest point, its date and how long it lasted.
- Compare it with the tier you wrote in your plan, and record the decision in your Friday review.
Mistakes that make drawdowns worse
- Reading only the blended account curve, so a losing strategy keeps getting capital because another one is doing well.
- Setting the stop-out level after the drawdown has already started.
- Measuring before charges. On active options strategies, STT and brokerage can turn a flat curve into a slow drawdown.
- Doubling size after a new high to make up for lost time.
Questions traders ask
Should I measure drawdown in rupees or as a percentage?
Use a percentage of the capital allocated to that strategy. Rupees work for a single strategy, but percentages let you compare a small scalping strategy with a large swing strategy on the same scale.
Should charges be included in the equity curve?
Yes. Plot the curve after brokerage, STT, exchange charges and GST. On active options strategies the difference between a gross and a net curve can be the difference between an edge and a slow drawdown.
How many trades do I need before a drawdown means anything?
Aim for at least 30 closed trades on a strategy before you judge its curve. Below that, a single bad week can dominate the shape and push you into changing a setup that was working.