
Fundamental Analysis Glossary
Earnings, valuation and balance-sheet ratios for NSE-listed companies, with notes on when they matter to a trader.
About fundamental analysis terms
Fundamental terms describe the business behind a share. EPS, EBITDA and the margin ratios show how much it earns. ROE, ROCE and return on assets show how well it uses its capital. Debt-to-equity and the current ratio show how much it owes. P/E, forward P/E, P/B, PEG, enterprise value and market cap show what the market is paying for all of it.
Short-term traders rarely trade on these numbers, but results days still reach their positions: a stock can gap several percent at the open after quarterly numbers, and an earnings surprise can jump straight past a stop. Swing and positional traders often filter a watchlist with two or three ratios and decide in advance whether to hold through results. If you do that, note the ratio or event that put each stock on your list, so a later review can show whether the filter improved results. Compare ratios within one sector, since a normal P/E for a bank is not a normal P/E for a software company.
Key terms in this category
Start with these, then use the full list below.
- In-depthP/E RatioThe P/E ratio (price-to-earnings) is a share’s price divided by its earnings per share, so it shows how many rupees investors pay for each…P/E = Share price ÷ Earnings per share (EPS), or equivalently Market capitalisation ÷ Net profit
- In-depthEPS (Earnings Per Share)Earnings per share (EPS) is a company’s net profit for a period divided by the number of its equity shares, so it shows how much profit…Basic EPS = (Profit after tax attributable to equity holders − Preference dividends) ÷ Weighted average equity shares; Diluted EPS adds shares from options, warrants and convertibles
- In-depthROE (Return on Equity)Return on equity (ROE) is net profit as a percentage of shareholders’ equity: how much the company earns on the money its owners have put…ROE % = Net profit ÷ Shareholders’ equity × 100. DuPont: ROE = Net margin × Asset turnover × Equity multiplier
- In-depthDebt to EquityThe debt-to-equity ratio (D/E) compares how much a company has borrowed with how much its shareholders have put in and retained.Debt-to-equity = Total borrowings ÷ Shareholders’ equity; Net debt-to-equity = (Total borrowings − Cash and equivalents) ÷ Shareholders’ equity
- In-depthMarket CapitalisationMarket capitalisation is the total market value of a company’s shares: share price × number of shares outstanding.Market cap = Share price × Total shares outstanding; Free-float market cap = Market cap × Free-float share (the part not held by promoters and other locked-in holders)
- In-depthFree Cash FlowFree cash flow (FCF) is the cash a business generates from operations after paying for the capital spending needed to keep and grow it.Free cash flow = Cash flow from operating activities − Capital expenditure; FCF yield = FCF ÷ Market capitalisation × 100
All 22 fundamental analysis terms
- Earnings SurpriseAn earnings surprise is the gap between the profit a company reports and what analysts expected, usually measured on EPS and expressed as a percentage of the estimate.
- EBITDAEBITDA is earnings before interest, tax, depreciation and amortisation: the profit a business makes from operations before financing costs, tax and the accounting charge…
- Economic MoatAn economic moat is a lasting advantage that lets a company keep earning above-normal returns while competitors try to take them away, such as a strong brand, a network…
- Enterprise ValueEnterprise value (EV) is what it would cost to buy a whole company: the market value of its shares plus its debt, minus the cash it holds.
- EPS (Earnings Per Share)Earnings per share (EPS) is a company’s net profit for a period divided by the number of its equity shares, so it shows how much profit each share earned.
- Forward P/EForward P/E divides today’s share price by the earnings per share expected over the next financial year, usually the analyst consensus, instead of the EPS already…
- Free Cash FlowFree cash flow (FCF) is the cash a business generates from operations after paying for the capital spending needed to keep and grow it.
- P/B RatioThe P/B ratio (price-to-book) compares a share’s market price with its book value per share, the accounting value of shareholders’ equity.
- P/E RatioThe P/E ratio (price-to-earnings) is a share’s price divided by its earnings per share, so it shows how many rupees investors pay for each rupee of yearly profit.
- PEG RatioThe PEG ratio divides the P/E ratio by the annual growth rate of earnings per share, to show whether a P/E is high or low for the growth on offer.
- Price-to-Sales Ratio (P/S)The price-to-sales ratio (P/S) compares a company’s market value with its revenue over the last twelve months.
- Return on Assets (ROA)Return on assets (ROA) is net profit as a percentage of total assets: how much profit a company makes from everything it owns, however that is funded.
- Return on Capital Employed (ROCE)ROCE (return on capital employed) measures operating profit before interest and tax against all the long-term capital a business uses, both equity and debt.
- Revenue Growth RateRevenue growth is the percentage change in a company’s sales between two periods, most often measured year on year.
- ROE (Return on Equity)Return on equity (ROE) is net profit as a percentage of shareholders’ equity: how much the company earns on the money its owners have put in and left in the business.
Checking results stock by stock
The Symbols report ranks the stocks you traded by wins, losses, win rate, profit and ROI. If you build a watchlist from fundamental filters, this is where you see whether those stocks paid.
See analytics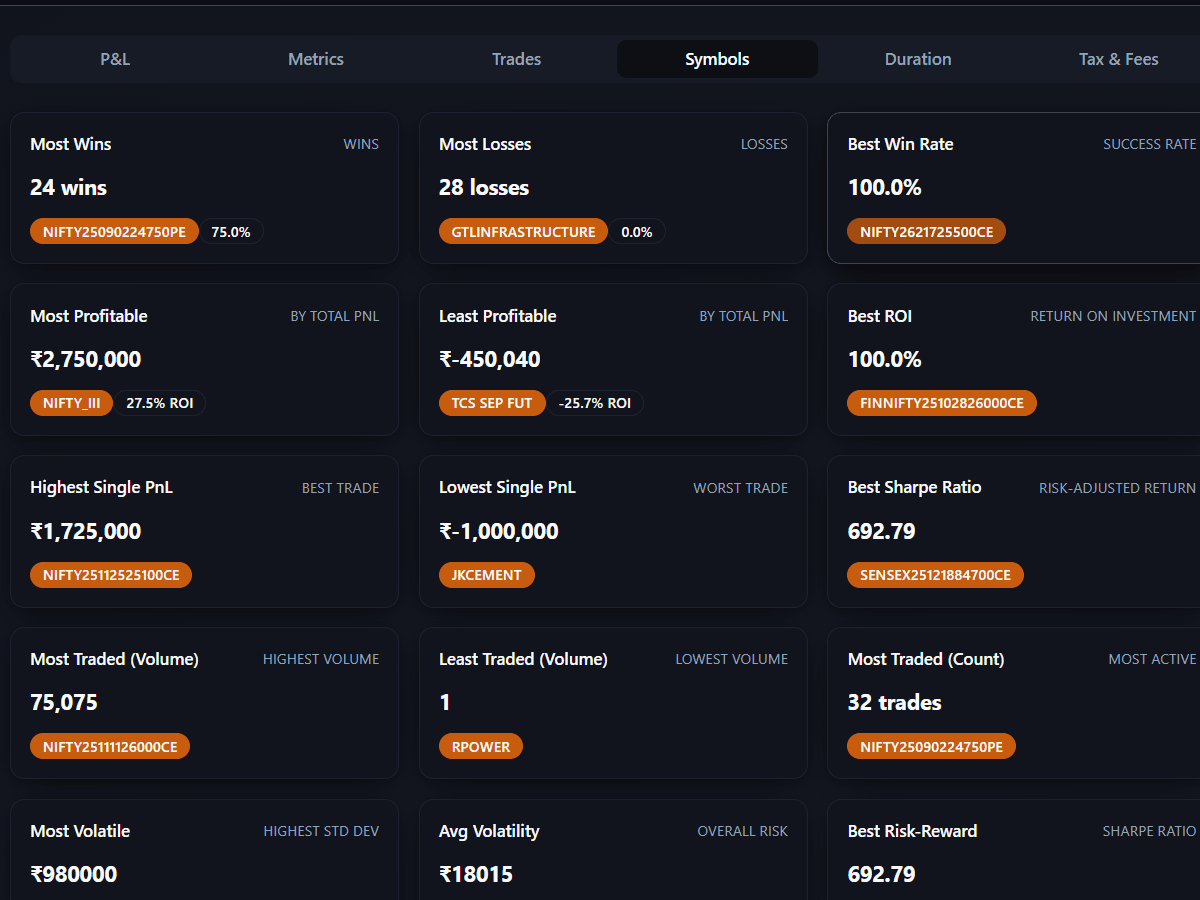
Guides and tools for fundamental analysis
- GuideHow to analyze P&L by period, time of day and symbolCompare trading P&L across fair, equal periods, find the sessions and weekdays that cost you money, and spot when one NSE symbol is carrying your whole month.
- GuideHow to review your trading journal each weekA short trading journal review routine: a 3-minute note after each session, a 15-minute Friday checklist, a worst-trade replay and one written change.
- GuideHow to compare trading journal entriesCompare two trading days or weeks on setup, size, time, mood and rule adherence, so you can tell a bad market from bad behaviour and pick one fix.
Other categories
All 370 terms, A to Z →Track it on your own trades
Connect your Indian broker and review every trade with tags, notes and per-strategy numbers.